Beware of jumping off the USDOLLAR bandwagon too soon

.png)
FXCM's USDOLLAR basket has weakened over the last four trading sessions. To this end, the basket has moved from its bullish area between the upper blue and red bands into the neutral space between the blue bands. On a relative basis, this suggests greenback weakness. In addition, the stochastic shows erosion in the daily momentum, dropping below 80 (green rectangle). However, we are cautious in calling for an outright dollar top. Consider the USDOLLAR weekly chart:
.png)
Longer term, the USDOLLAR has charted a higher trough followed by a higher peak. Thus the greenback's primary trend is up. However, its RSI is in excess and is in the process of easing (blue vertical). This operation inevitably must include dollar weakness. However, once the oscillator's condition has normalised, it may set up the platform for higher dollar prices.
Forex market analysis has become more difficult recently. One reason is that it is still a safe have and risk market uncertainty persists. Another is the move from absolute central bank influence to relative influence. I.e. the Fed is no longer the only central bank pursuing aggressive tightening; others have entered the fray.
For example, tomorrow, the ECB will hike its main refinancing rate by at least 25bps. Yesterday, a report surfaced of a possible 50bps; however, this is speculative. Another example includes last week's surprise 100bps hike by the BoC. At the same time, the expectation for the Fed hike on the 27th of July oscillated between 75-100bps before settling on 75.
However, in all likelihood, the Fed is still dominant. For example, consider the German/US 2-yr note spread: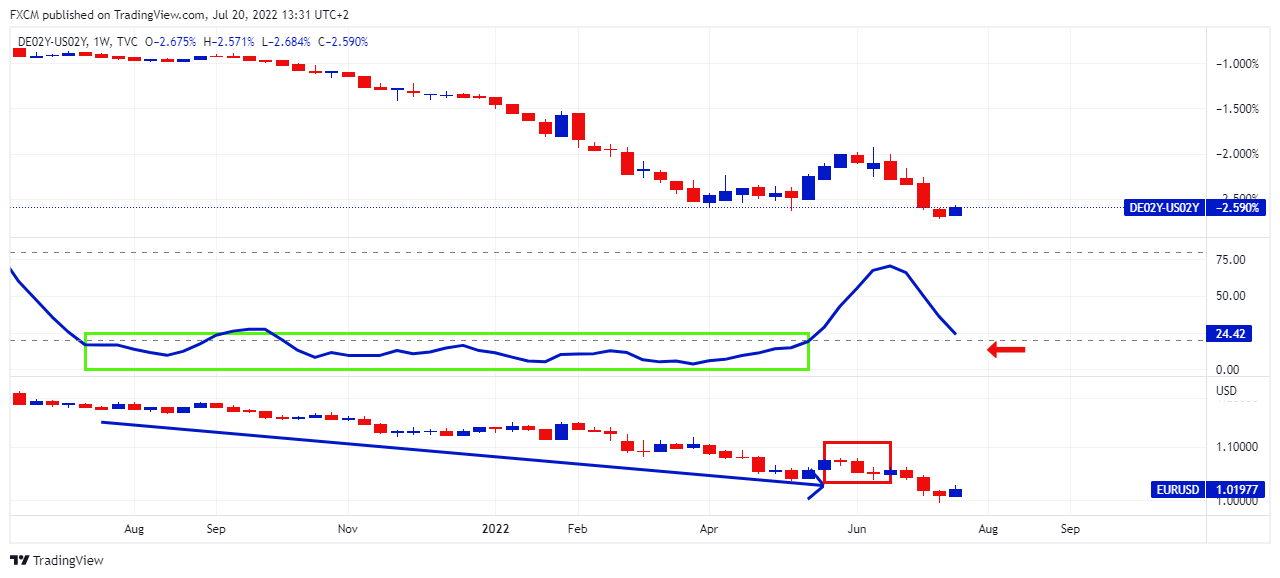
Source: www.tradingview.com
Central banks try to influence the short end of the curve with their monetary policy. Given this, the top chart shows a substantial decline in the German note relative to the US note. On the other hand, the stochastic (second chart) maintained its lower quintile, as the Fed's policy dominated (green rectangle). This power accompanied the devaluation of the EURUSD (lower chart).
Besides a slight bounce in the spreads, which benefitted the EURUSD (red rectangle), momentum is moving back in favour of the Fed. If the stochastic hits the lower quintile and maintains (red arrow), EURUSD will face pressure again.

Russell Shor
Senior Market Specialist
Russell Shor joined FXCM in October 2017 as a Senior Market Specialist. He is a certified FMVA® and has an Honours Degree in Economics from the University of South Africa. Russell is a full member of the Society of Technical Analysts in the United Kingdom. With over 20 years of financial markets experience, his analysis is of a high standard and quality.
Any opinions, news, research, analyses, prices, other information, or links to third-party sites contained on this website are provided on an "as-is" basis, as general market commentary and do not constitute investment advice. The market commentary has not been prepared in accordance with legal requirements designed to promote the independence of investment research, and it is therefore not subject to any prohibition on dealing ahead of dissemination. Although this commentary is not produced by an independent source, FXCM takes all sufficient steps to eliminate or prevent any conflicts of interests arising out of the production and dissemination of this communication. The employees of FXCM commit to acting in the clients' best interests and represent their views without misleading, deceiving, or otherwise impairing the clients' ability to make informed investment decisions. For more information about the FXCM's internal organizational and administrative arrangements for the prevention of conflicts, please refer to the Firms' Managing Conflicts Policy. Please ensure that you read and understand our Full Disclaimer and Liability provision concerning the foregoing Information, which can be accessed here.