Benchmark Real Yield Continues to Support USDOLLAR In Anticipation of Higher-For-Longer

Technical Analysis
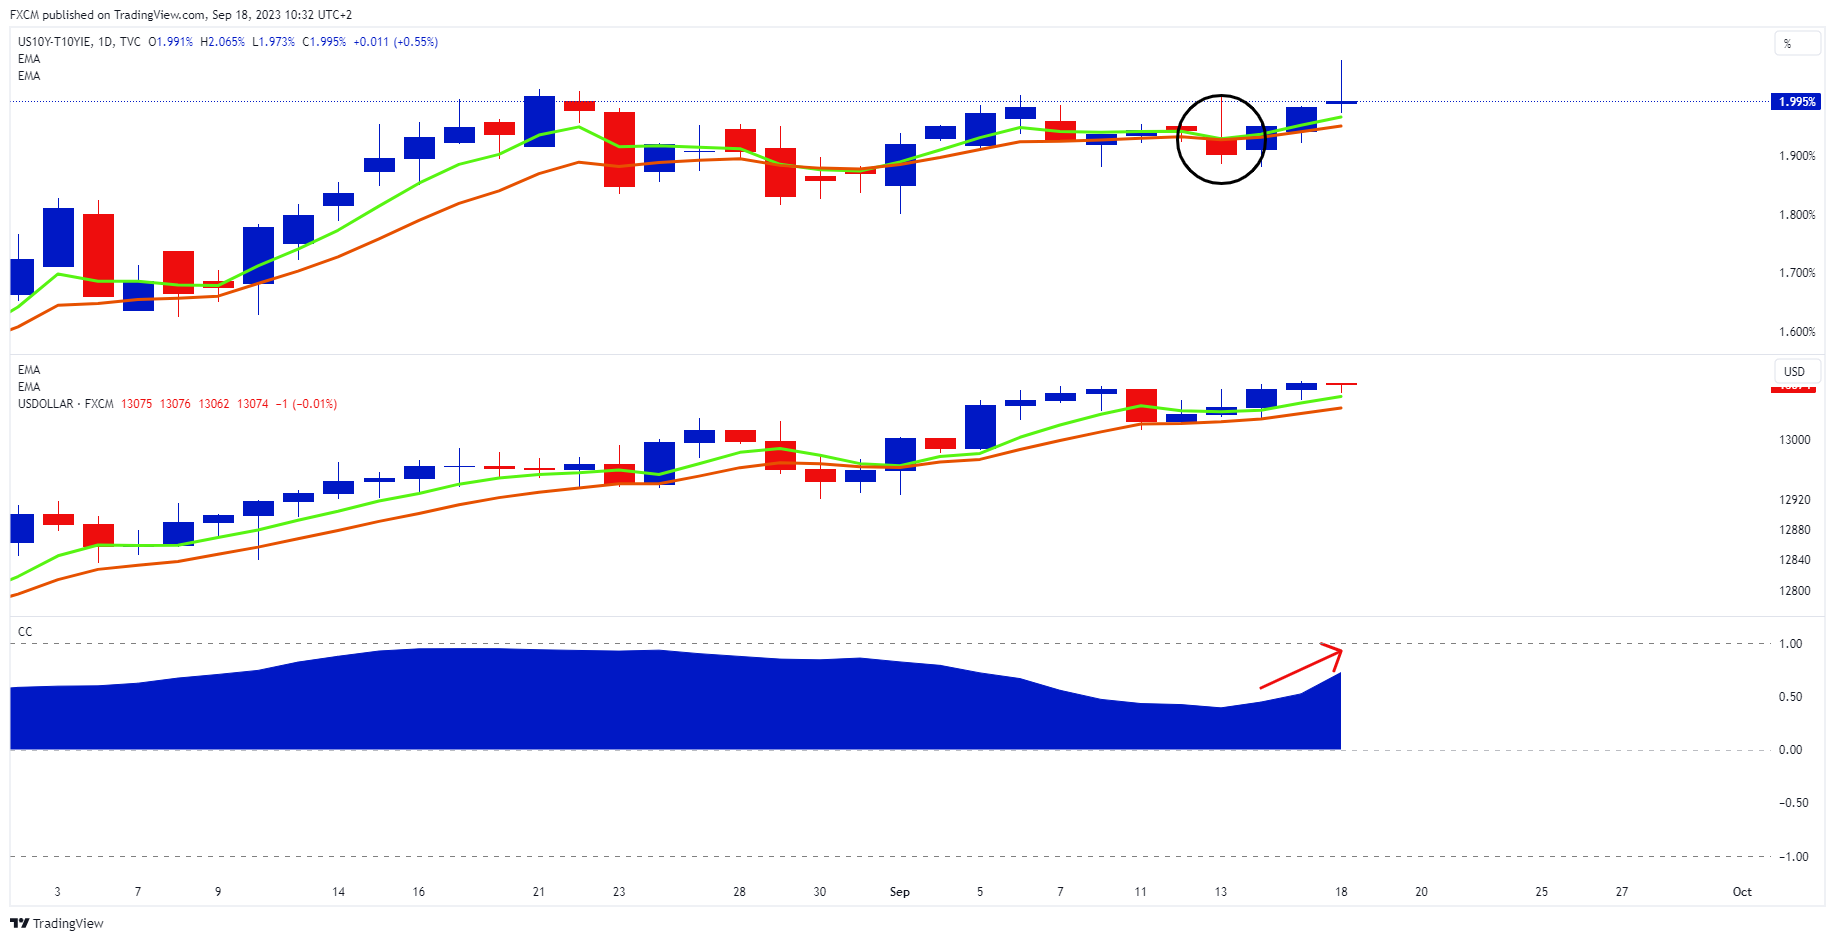
Source: www.tradingview.com
The US 10-year real yield's green 5-day EMA has pulled away from its orange 10-year EMA (black circle). This is suggestive of strength in the real yield, which is currently trading at 2%. This is elevated and is providing a layer of support for FXCM's USDOLLAR basket.
This is also evidenced by the USDOLLAR EMAs. Its green 5-day EMA is above its orange 10-year EMA, which is a bullish formation.
Interestingly, the correlation coefficient between the US 10-year real yield and the USDOLLAR has strengthened (red arrow) and is now a robust 72%.
Possibly Higher-For-Longer
The meeting of the Federal Open Market Committee this week carries significance, regardless of whether there are any adjustments to interest rate.
Following a remarkable period of monetary tightening, during which the Federal Reserve elevated its key federal-funds rate target by an unprecedented 5.25 percentage points over the last eighteen months, it is virtually assured that the central bank's policy-setting committee will maintain the existing key rate range of 5.25% to 5.5%.
The focal point is the trajectory of Federal Reserve policy in 2024 and the subsequent years. What holds greater significance than the peak of interest rates is the duration for which they will remain at that level.
The forecasts from both the FOMC and futures markets indicate a decrease in the fed funds rate for the upcoming year, under the presumption of a slowdown in both inflation and the economy. Nonetheless, the U.S. economy has demonstrated its resilience, and it is entirely possible that interest rates might remain elevated for an extended period. This is what the elevated US 10-year real yield seems to be suggesting.

Russell Shor
Senior Market Specialist
Russell Shor joined FXCM in October 2017 as a Senior Market Specialist. He is a certified FMVA® and has an Honours Degree in Economics from the University of South Africa. Russell is a full member of the Society of Technical Analysts in the United Kingdom. With over 20 years of financial markets experience, his analysis is of a high standard and quality.
Any opinions, news, research, analyses, prices, other information, or links to third-party sites contained on this website are provided on an "as-is" basis, as general market commentary and do not constitute investment advice. The market commentary has not been prepared in accordance with legal requirements designed to promote the independence of investment research, and it is therefore not subject to any prohibition on dealing ahead of dissemination. Although this commentary is not produced by an independent source, FXCM takes all sufficient steps to eliminate or prevent any conflicts of interests arising out of the production and dissemination of this communication. The employees of FXCM commit to acting in the clients' best interests and represent their views without misleading, deceiving, or otherwise impairing the clients' ability to make informed investment decisions. For more information about the FXCM's internal organizational and administrative arrangements for the prevention of conflicts, please refer to the Firms' Managing Conflicts Policy. Please ensure that you read and understand our Full Disclaimer and Liability provision concerning the foregoing Information, which can be accessed here.