Apple stock is approaching all-time highs with a tailwind behind it

Weekly Chart
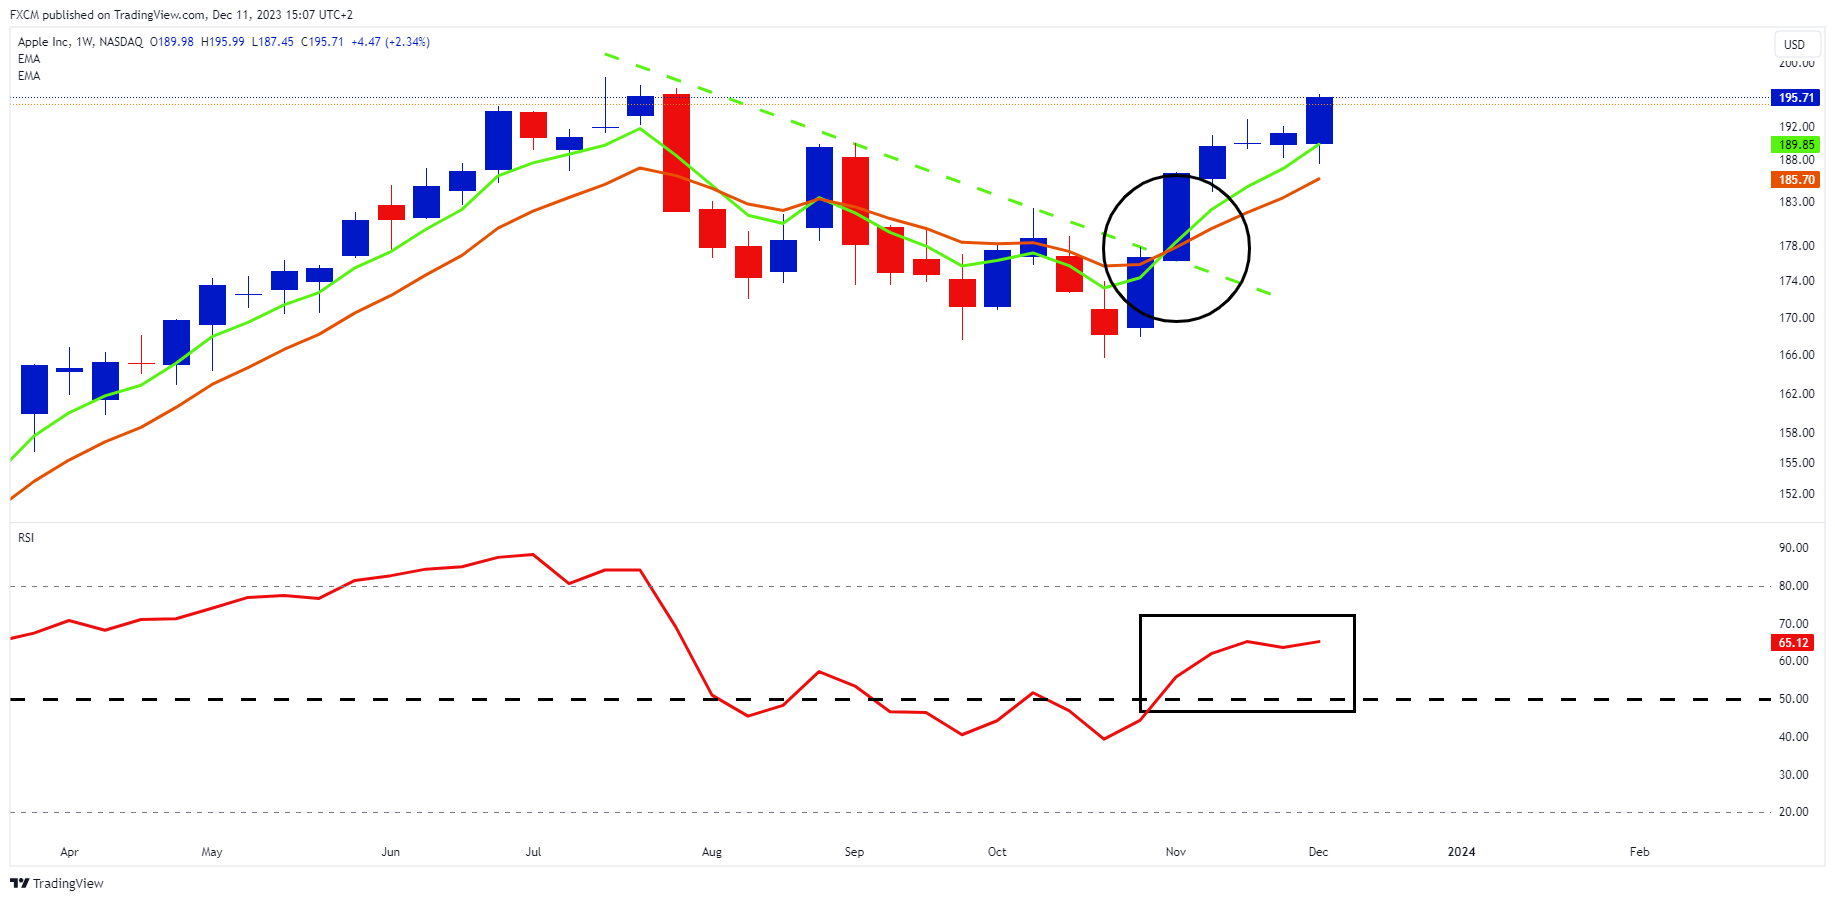
Source: www.tradingview.com
The last time I wrote about Apple (AAPL.us) was back on 16 October 2023 in an article titled "Apple Shows Interesting Weekly Technical Setup." It took some time, but the signals did eventually materialise.
1. Apple bullishly broke-out above its downward sloping dashed green trendline in November.
2. This coincided with the green 5-week EMA bullishly crossing above its orange 10-week EMA (black ellipse).
3. The EMAs have bullishly developed angle and separation to the upside.
4. The RSI has crossed to the bullish side of 50 (black rectangle). This denotes an underlying positive momentum that is price supportive.
Comment
AAPL.us is currently trading around $195, just shy of its all-time high, set in July, of $198.23. According to Wedbush analyst Dan Ives, iPhone shipments may be ahead of the 220-230 million units that Wall Street expects for the company's fiscal 2024.
If the pace continues it will bode well for AAPl.us and so far, demand seems to be robust in the US and China despite the threat of competition from Huawei. Ives bullishly raised his price target for AAPL.us from $240 per share to $250 per share.
If the RSI maintains above 50, Apple's stock price will have a tailwind behind it.

Russell Shor
Senior Market Specialist
Russell Shor joined FXCM in October 2017 as a Senior Market Specialist. He is a certified FMVA® and has an Honours Degree in Economics from the University of South Africa. Russell is a full member of the Society of Technical Analysts in the United Kingdom. With over 20 years of financial markets experience, his analysis is of a high standard and quality.
Any opinions, news, research, analyses, prices, other information, or links to third-party sites contained on this website are provided on an "as-is" basis, as general market commentary and do not constitute investment advice. The market commentary has not been prepared in accordance with legal requirements designed to promote the independence of investment research, and it is therefore not subject to any prohibition on dealing ahead of dissemination. Although this commentary is not produced by an independent source, FXCM takes all sufficient steps to eliminate or prevent any conflicts of interests arising out of the production and dissemination of this communication. The employees of FXCM commit to acting in the clients' best interests and represent their views without misleading, deceiving, or otherwise impairing the clients' ability to make informed investment decisions. For more information about the FXCM's internal organizational and administrative arrangements for the prevention of conflicts, please refer to the Firms' Managing Conflicts Policy. Please ensure that you read and understand our Full Disclaimer and Liability provision concerning the foregoing Information, which can be accessed here.