Amazon is setting up to outperform the broader S&P 500

Source: www.tradingview.com
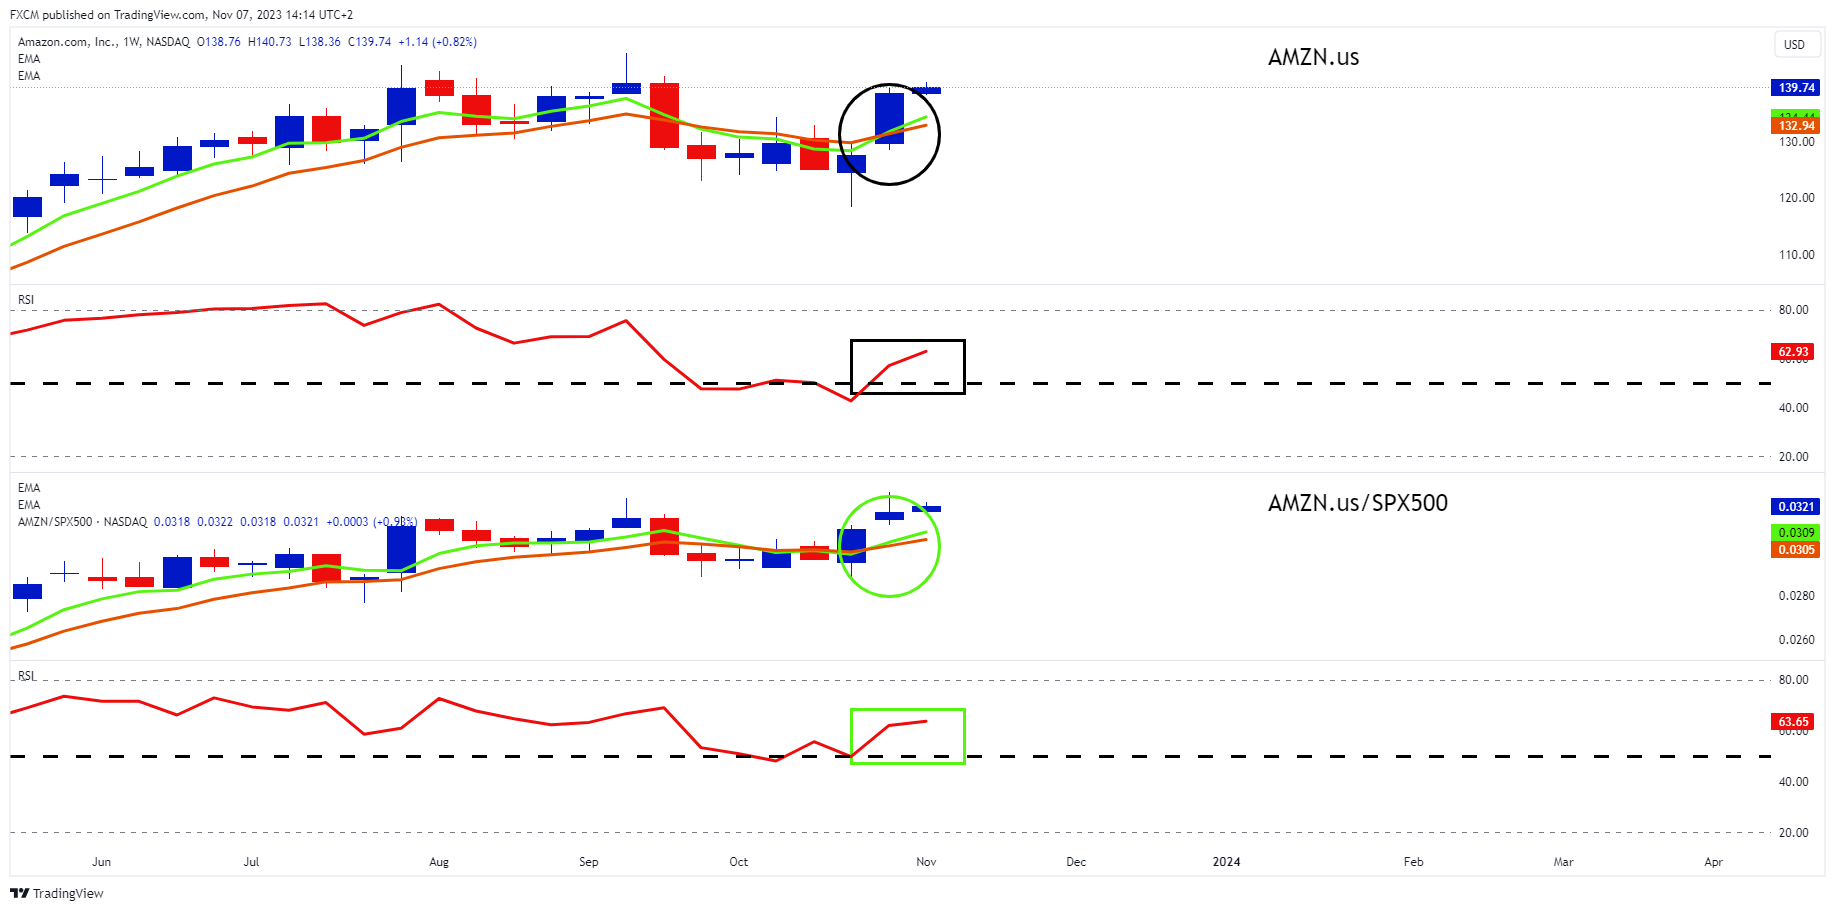
Amazon (AMZN.us) has set up positively on a technical basis. The top candlestick chart shows the stock's 5-week EMA crossing above its orange 10-week EMA (black circle). At the same time the weekly RSI has moved above 50 (black rectangle), which is the bullish side of the indicator. If the EMAs develop angle and separation to the upside, and the daily RSI maintains above 50, an underlying bullish momentum will be supporting AMZN.us.
On a relative strength basis (bottom candlestick chart), the technicals are also looking promising. We consider AMZN.us/SPX500, where AMZN.us is the numerator and SPX500 is the denominator, as a relative strength (RS) chart. The RS's green 5-week EMA has crossed above its orange 10-week EMA (green circle) and its weekly RSI is also above 50 (green rectangle). This suggests that the numerator (AMZN.us) is outperforming the denominator (SPX500). If the EMAs develop angle and separation to the upside and the RSI remains above 50, this outperformance will continue.
Shares of AMZN.us have been positively buoyed by the company's strong Q3 earnings, which beat Wall Street expectations on 27 October. As we look ahead to the coming year, Amazon stands out as a potential success story for investors. Amazon Web Services (AWS) is poised for significant growth, North American operating income has exceeded expectations, the international business is approaching break-even, and revenue continues to maintain a robust double-digit growth trajectory. All these factors make Amazon a compelling choice for those seeking strong earnings growth in the market as we move into 2024.

Russell Shor
Senior Market Specialist
Russell Shor joined FXCM in October 2017 as a Senior Market Specialist. He is a certified FMVA® and has an Honours Degree in Economics from the University of South Africa. Russell is a full member of the Society of Technical Analysts in the United Kingdom. With over 20 years of financial markets experience, his analysis is of a high standard and quality.
Any opinions, news, research, analyses, prices, other information, or links to third-party sites contained on this website are provided on an "as-is" basis, as general market commentary and do not constitute investment advice. The market commentary has not been prepared in accordance with legal requirements designed to promote the independence of investment research, and it is therefore not subject to any prohibition on dealing ahead of dissemination. Although this commentary is not produced by an independent source, FXCM takes all sufficient steps to eliminate or prevent any conflicts of interests arising out of the production and dissemination of this communication. The employees of FXCM commit to acting in the clients' best interests and represent their views without misleading, deceiving, or otherwise impairing the clients' ability to make informed investment decisions. For more information about the FXCM's internal organizational and administrative arrangements for the prevention of conflicts, please refer to the Firms' Managing Conflicts Policy. Please ensure that you read and understand our Full Disclaimer and Liability provision concerning the foregoing Information, which can be accessed here.