Alphabet looking to tackle overhead resistances as it revamps advertising unit

Source: www.tradingview.com
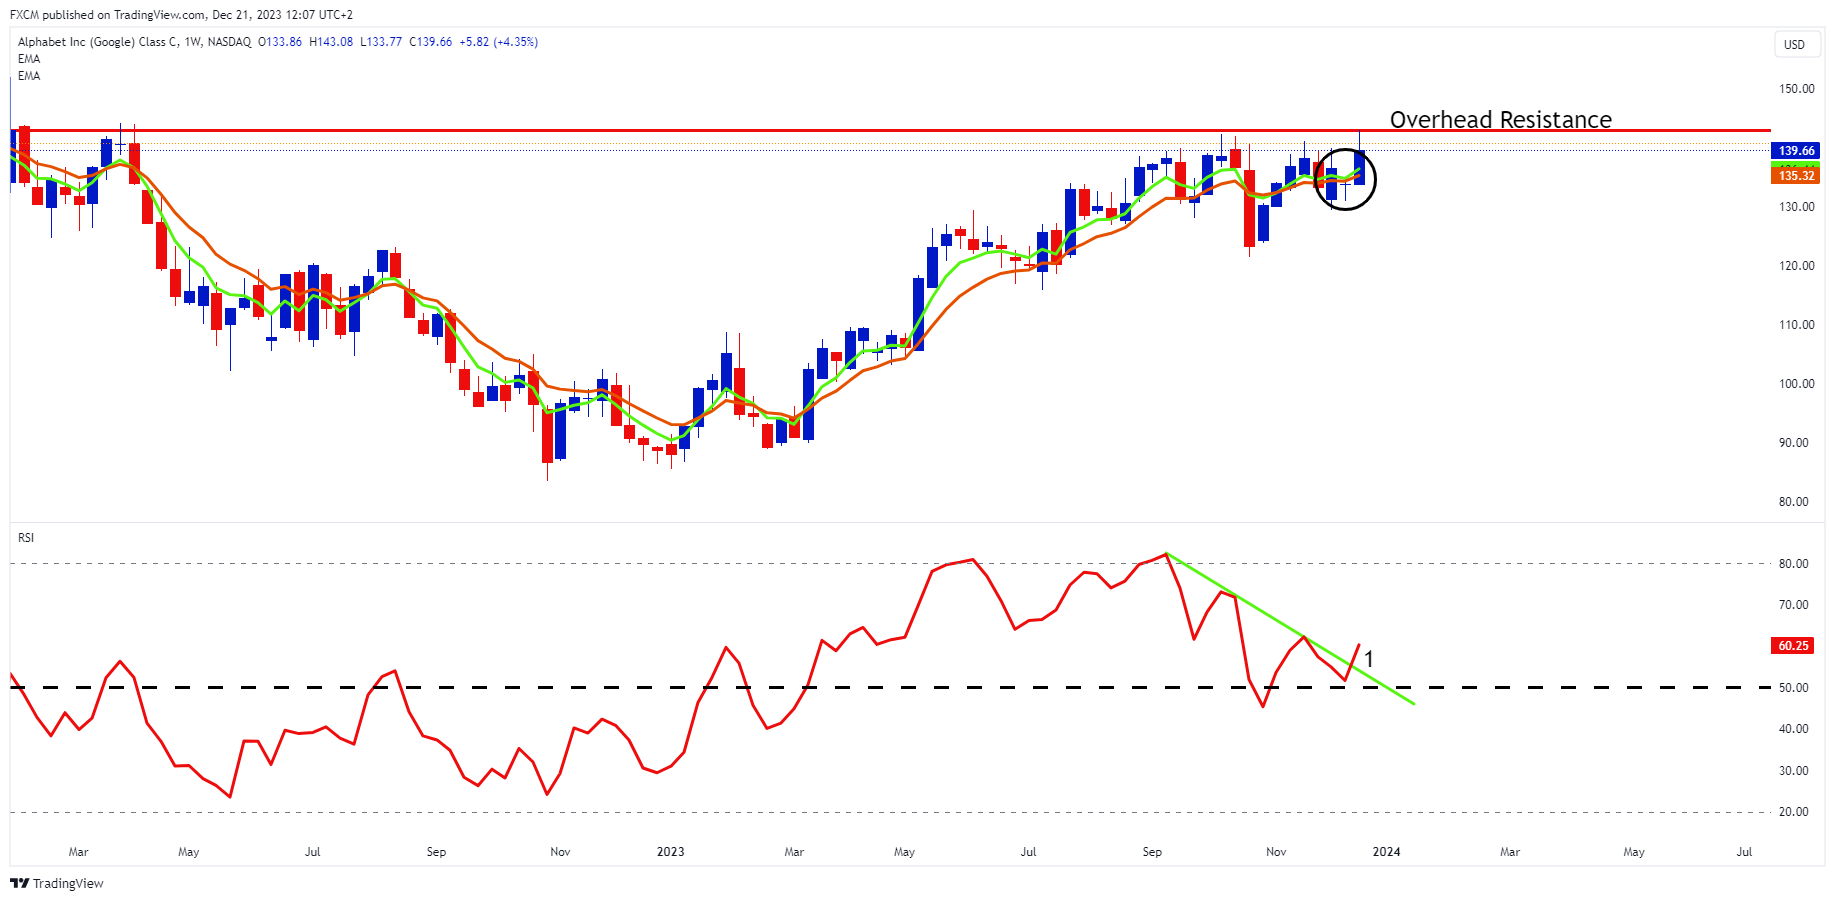
Alphabet (GOOG.us) is trading at levels last seen in April 2022, with $145.00 being regarded as overhead resistance (red vertical line). There are some promising technical developments, which if maintained, should see GOOG.us overcome this overhead resistance.
Firstly, the RSI is trading above 50 and has bullishly broken above the green down sloping trendline at 1. This suggests that the underlying positive momentum is improving. The longer the RSI maintains above 50, the greater the likelihood that the overhead resistance will fall.
Secondly, the stock's green 5-week EMA is bullishly above its orange 10-week EMA (black circle). If the EMAs develop angle and separation to the upside, price will be moving upwards.
A recent announcement indicates that the company is looking to reorganise a large part of its advertising sales unit. This is potentially significant because GOOG.us has relied heavily on its advertising unit to generate top line sales. It recorded $59.6bn or close to 78% of Alphabet's total Q3 revenue of $76.7bn.
The timing here is also at a critical juncture because it is concurrent with machine learning methods that have been implemented to help the company sell advertising on Google and YouTube.
Raymond James analyst Josh Beck covers Alphabet and has assigned a $150 target price with an Outperform rating. He expressed confidence in the company's generative artificial intelligence.

Russell Shor
Senior Market Specialist
Russell Shor joined FXCM in October 2017 as a Senior Market Specialist. He is a certified FMVA® and has an Honours Degree in Economics from the University of South Africa. Russell is a full member of the Society of Technical Analysts in the United Kingdom. With over 20 years of financial markets experience, his analysis is of a high standard and quality.
Any opinions, news, research, analyses, prices, other information, or links to third-party sites contained on this website are provided on an "as-is" basis, as general market commentary and do not constitute investment advice. The market commentary has not been prepared in accordance with legal requirements designed to promote the independence of investment research, and it is therefore not subject to any prohibition on dealing ahead of dissemination. Although this commentary is not produced by an independent source, FXCM takes all sufficient steps to eliminate or prevent any conflicts of interests arising out of the production and dissemination of this communication. The employees of FXCM commit to acting in the clients' best interests and represent their views without misleading, deceiving, or otherwise impairing the clients' ability to make informed investment decisions. For more information about the FXCM's internal organizational and administrative arrangements for the prevention of conflicts, please refer to the Firms' Managing Conflicts Policy. Please ensure that you read and understand our Full Disclaimer and Liability provision concerning the foregoing Information, which can be accessed here.