Alphabet (GOOG.us) top-down analysis shows bullish bias

Comment
There was uncertainty regarding GOOG.us financials with an initial negative perception about a slump in its digital ad market and its potential use of artificial intelligence. However, it released its Q2 earnings on 25 July, which showed that revenue had grown by 7% to $74.6bn. Its ad revenue grew by a modest 3.3% from a year before but was an improvement over Q1. Search revenue, which is most of its Ad business, showed steady growth for the quarter.
During the call, executives sounded optimistic, saying things are looking up. They talked a lot about AI, trying to reassure investors that they are using the technology throughout the company. However, Google has not announced a specific date for when their Search Generative Experience (SGE) will be available to everyone. SGE is expected to generate search results for complex queries.
Google can benefit regardless of the state of the ad market because of its cloud infrastructure. It competes with Amazon Web Services and Microsoft Azure in this area. Many AI companies prefer Google's cloud technology for running compute-heavy projects, which are limited to only a few platforms.
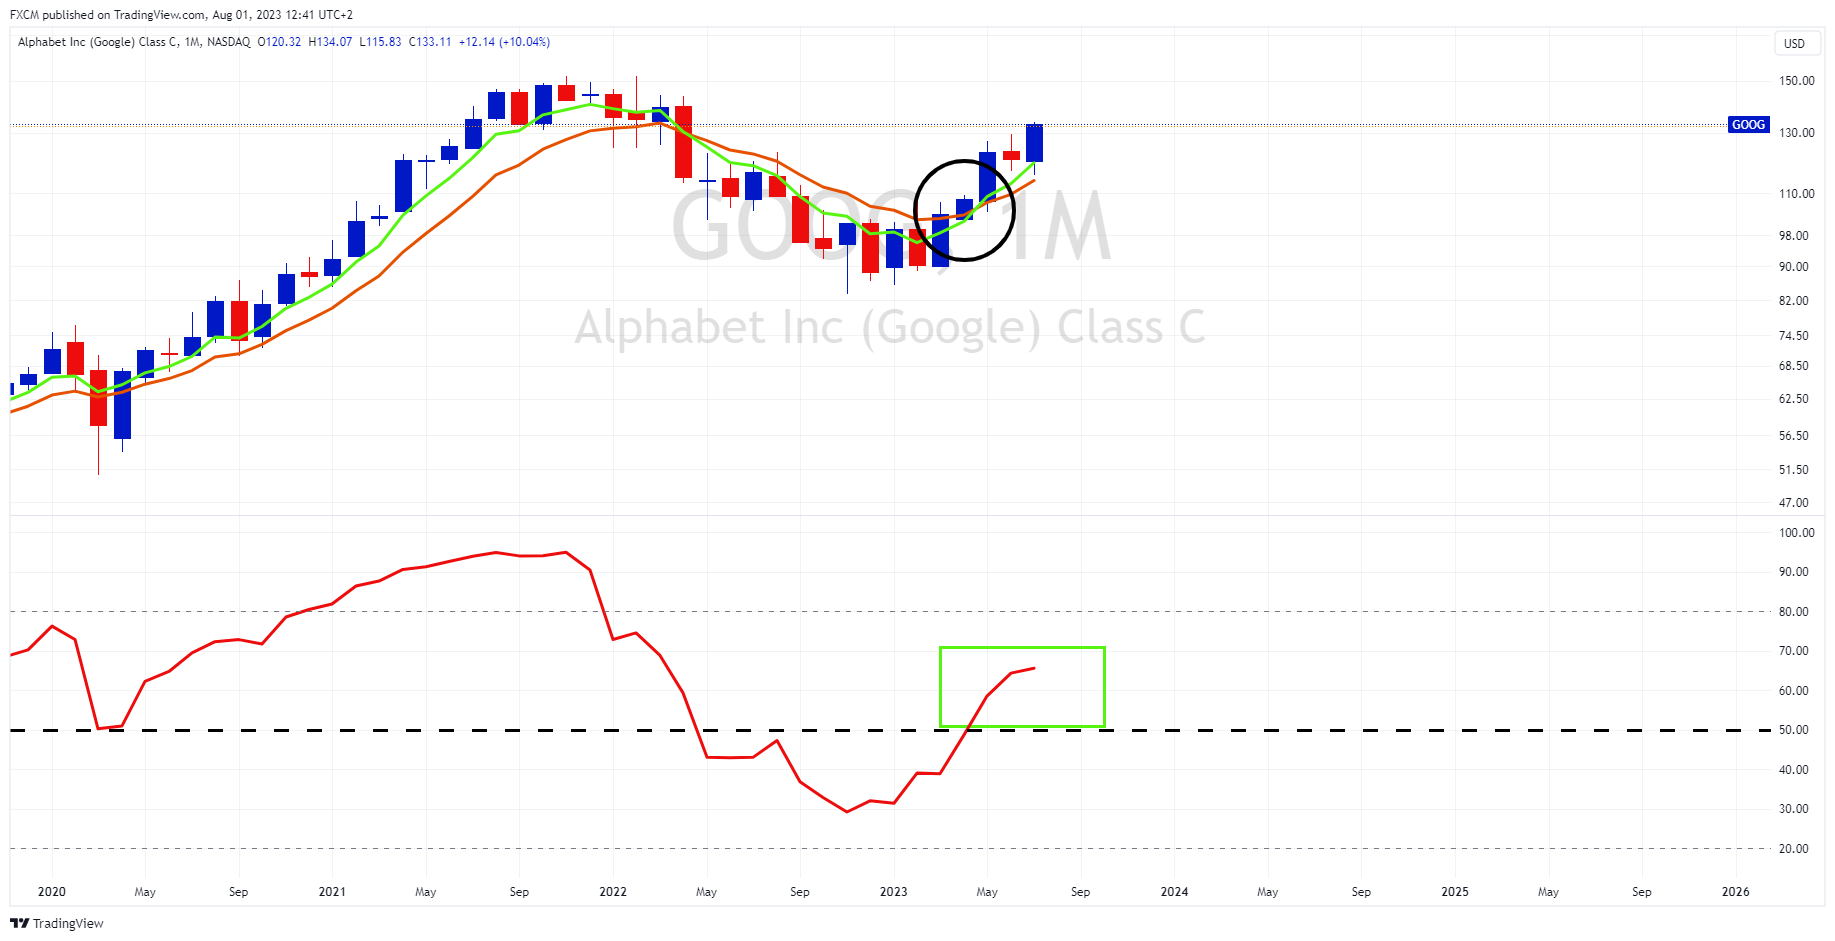
Monthly Chart Analysis (Primary Trend)
Source: www.tradingview.com
- The exponential moving average (EMA) is a trend-following indicator.
- Alphabet's green 5-month EMA has bullishly crossed above its orange 10-month EMA (black ellipse).
- The EMAs have developed angle and separation, which is a bullish sign.
- The monthly RSI has popped above 50 (green rectangle).
- This is the bullish side of the oscillator. The longer it maintains on this side, the more underlying support for the bullish primary trend.
- The monthly chart is considered a proxy for the GOOG.us primary trend. I.e., it is the core driver of trend direction.
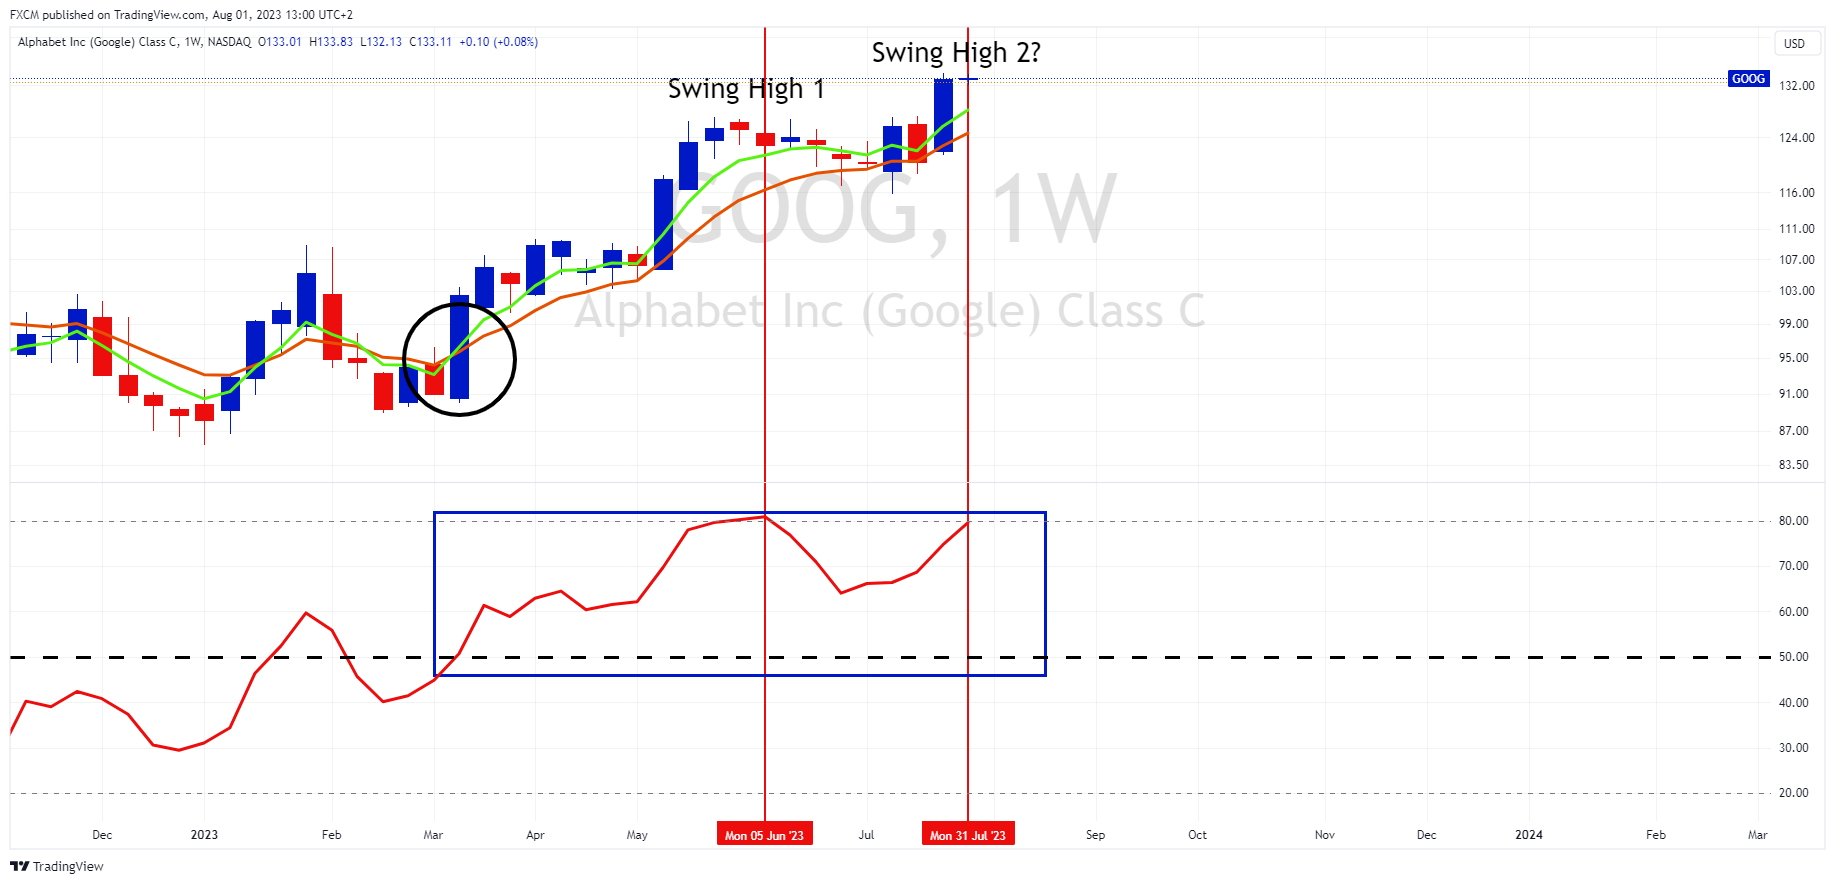
Weekly Chart Analysis (Swing High)
Source: www.tradingview.com
- The weekly EMAs are also in bullish mode, with the shorter term green 5-week EMA above the longer orange 10-week EMA.
- The EMAs are bullishly showing angle and separation to the upside.
- The weekly RSI is on the bullish side of 50 (blue rectangle).
- The longer it maintains on this side, the greater the momentum support for the weekly chart.
- The RSI is tending towards 80, which is regarded as overbought.
- We are not expecting a trend change due to the overbought condition.
- However, it may be the precursor for a swing high. If so, it may be a "dip in an uptrend" opportunity.
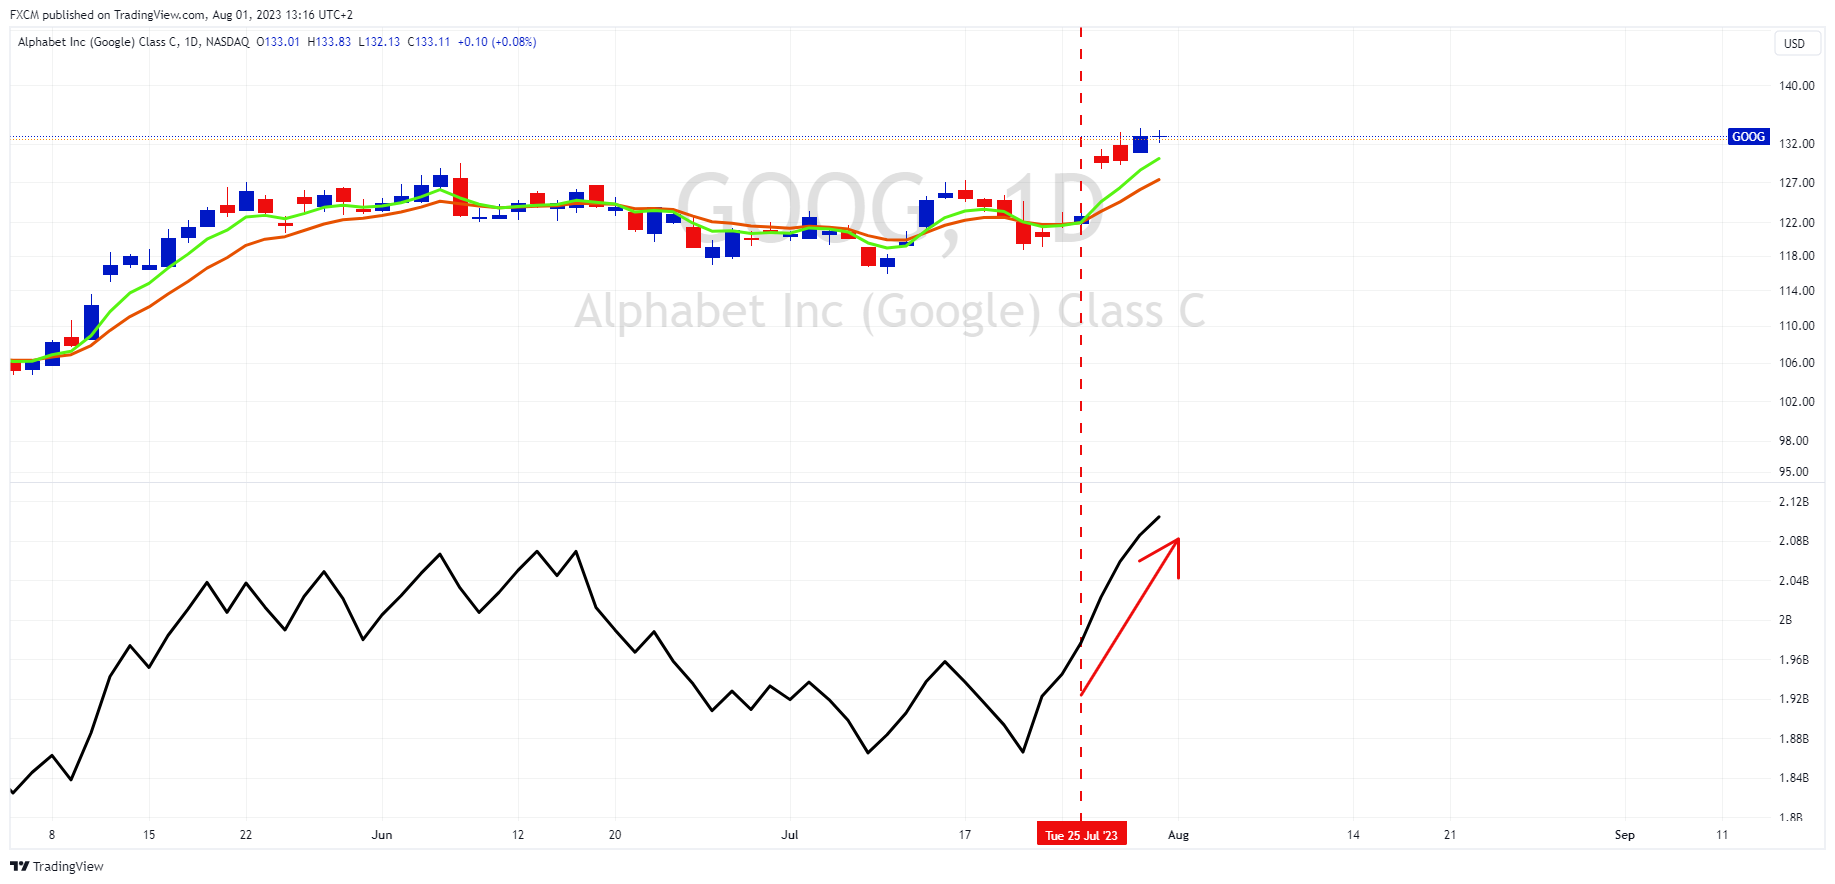
Daily Chart (Breakaway Gap)
Source: www.tradingview.com
- Following the release of Alphabet's Q2 results, its stock price gapped up.
- This may be a breakaway gap.
- These occur when price action breaks out of a trading range.
- Importantly, we see that volume picked up (red arrow) as its price gapped.
- This suggests that the breakout had a force behind it, and that an underlying momentum accompanied the gap.
- Whilst this does not guarantee a continuation of the move, it is regarded as positive.

Russell Shor
Senior Market Specialist
Russell Shor joined FXCM in October 2017 as a Senior Market Specialist. He is a certified FMVA® and has an Honours Degree in Economics from the University of South Africa. Russell is a full member of the Society of Technical Analysts in the United Kingdom. With over 20 years of financial markets experience, his analysis is of a high standard and quality.
Any opinions, news, research, analyses, prices, other information, or links to third-party sites contained on this website are provided on an "as-is" basis, as general market commentary and do not constitute investment advice. The market commentary has not been prepared in accordance with legal requirements designed to promote the independence of investment research, and it is therefore not subject to any prohibition on dealing ahead of dissemination. Although this commentary is not produced by an independent source, FXCM takes all sufficient steps to eliminate or prevent any conflicts of interests arising out of the production and dissemination of this communication. The employees of FXCM commit to acting in the clients' best interests and represent their views without misleading, deceiving, or otherwise impairing the clients' ability to make informed investment decisions. For more information about the FXCM's internal organizational and administrative arrangements for the prevention of conflicts, please refer to the Firms' Managing Conflicts Policy. Please ensure that you read and understand our Full Disclaimer and Liability provision concerning the foregoing Information, which can be accessed here.