The US consumer is in a precarious position

Introduction
Consumer spending makes up close to 70% of the US nominal GDP. However, the GDP annual growth rate in Q1 '22 declined to 3.4% from Q4 21's 5.5%. Therefore an analysis of the health of the consumption component is prudent.
Light-Weight Vehicle Sales
The auto industry is a hub. i.e. it connects with many other industries, and its health will help gauge the economy's general health. Moreover, it serves as a sentiment indicator because it is a large ticket item, second to buying a house.
Most people will need to borrow money to buy a car. Their willingness to do so tells us how confident they are about having the funds to repay this debt. In other words, if consumers are wary about being laid off soon, it is unlikely that they will commit to buying a car. Moreover, a positive trend in the series generally supports economic activity.
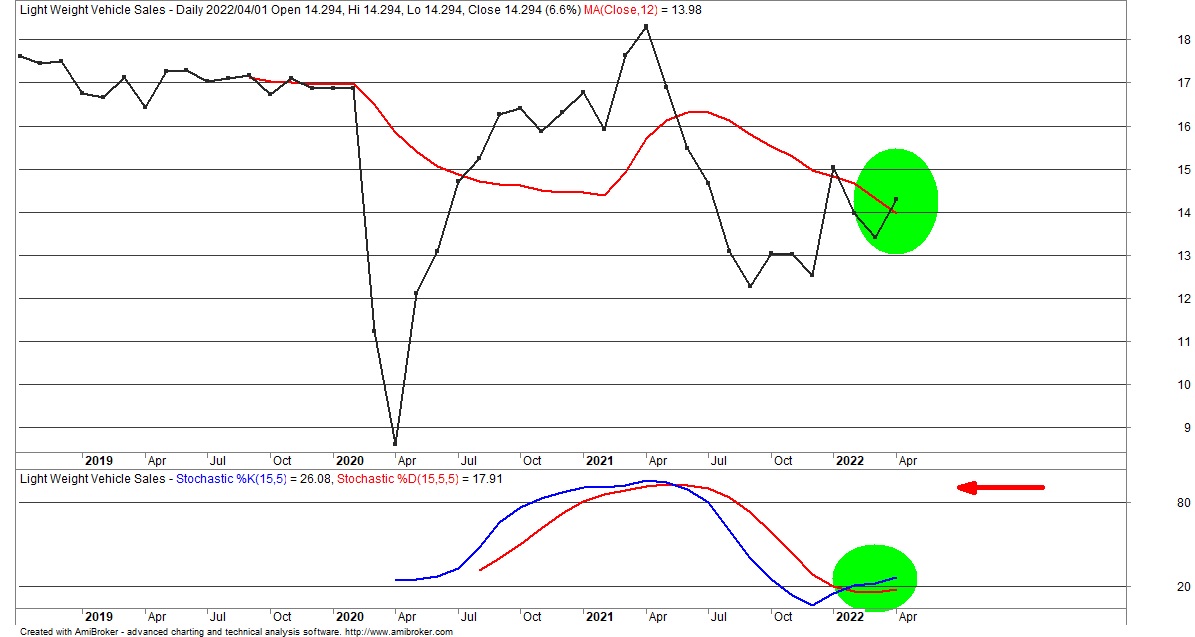
Light weight vehicle sales are increasing, the series has moved above its 12-month simple moving average (SMA), and its stochastic has crossed positively (green ellipses). However, we regard the cross as tentative for now. The SMA still needs to turn up and the stochastic to move towards its upper quintile (red arrow) for us to grow positive here.
Chain Stores Sales
General consumption is a measure of economic well-being. In this regard, chain store data is enlightening. Whilst representing a fraction of overall retail sales, chain stores tend to be national. Moreover, they are marketing powerhouses, and if they dip, it is a sign of general retail degradation.
The Johnson Redbook Index is a sales-weighted year on year index of large US retailers. It is updated weekly on a Tuesday. The series shows that sales are increasing but at a decreasing rate. I.e. sales are growing, but this growth has slowed significantly.
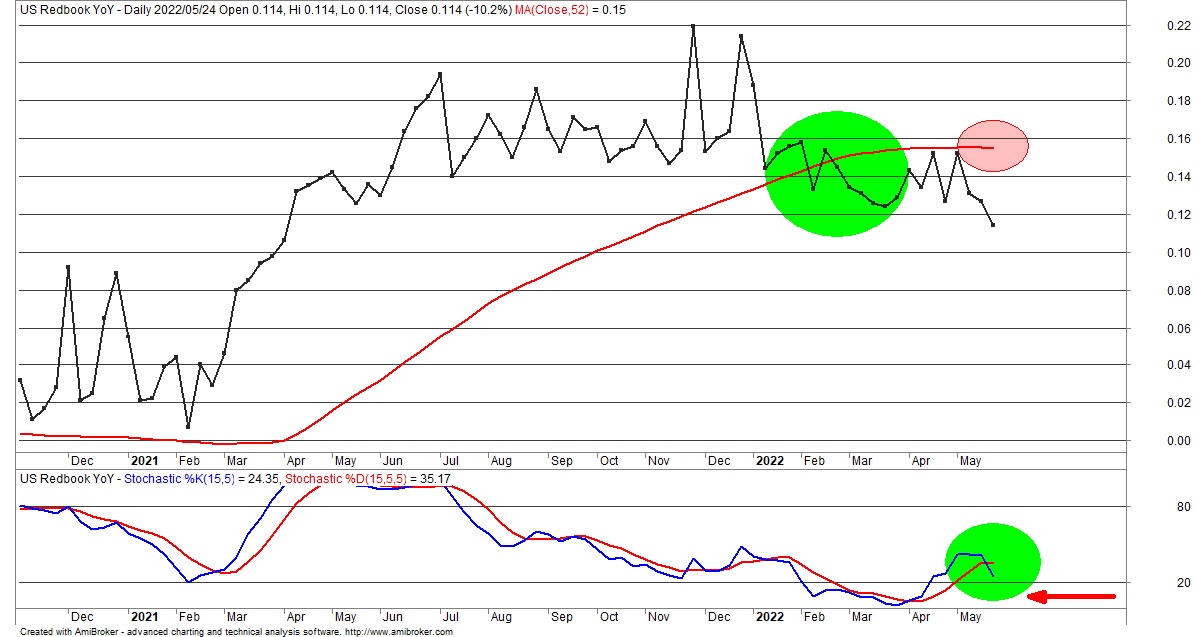
The Redbook Index is below its 52-week SMA, and its stochastic has rolled over (green ellipses). Moreover, the SMA
has turned down (red ellipse). Therefore, if the stochastic falls below 20 for a sustained period (red arrow), there is a risk that the deceleration in sales growth turns negative. i.e. chain store top lines are in danger of contracting.
Consumer Sentiment
Consumer sentiment measures how good the consumer is feeling. This data is helpful because consumers tend to spend more when they feel good.
The University of Michigan Consumer Sentiment Survey updates the survey by conducting at least 500 telephone interviews each month. The University asks fifty core questions regarding the interviewees' financial situation and short-term and longer-term expectations for the economy. The survey reflects current sentiment based on the answers received.
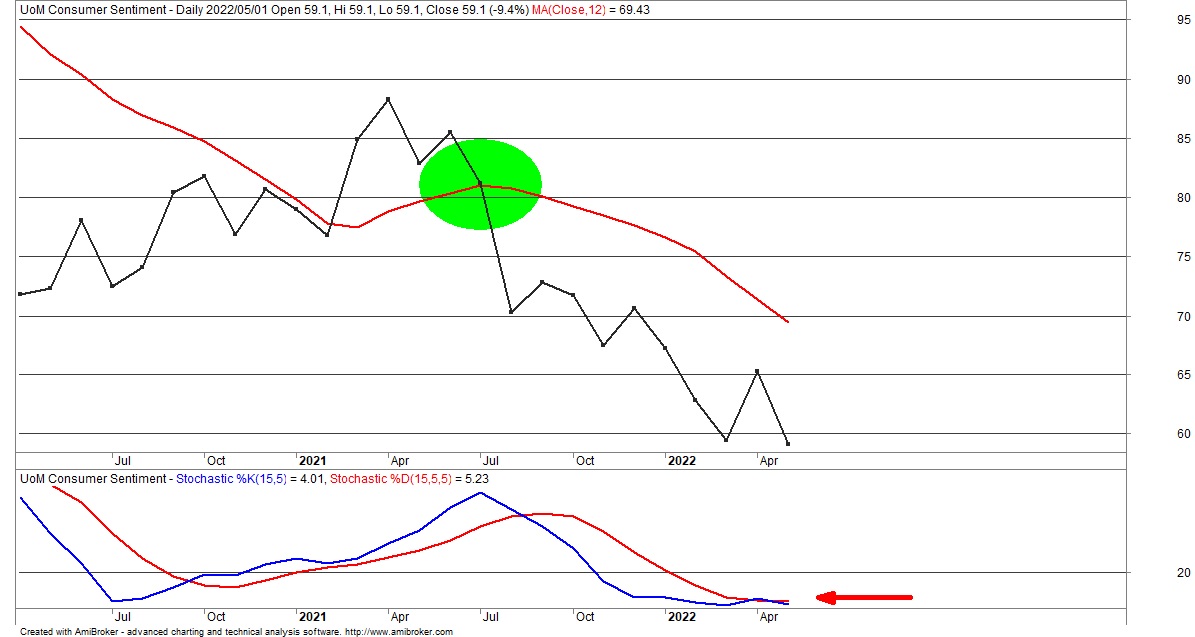
The series is concerning. It is under its 12-month SMA (green ellipse), and the slope of the SMA is down.
Alarmingly, the stochastic is maintained below 20, indicating an exceptionally gloomy and pessimistic consumer.
Existing-Home Sales
A house represents a considerable part of a person's wealth and any developments in this market impact consumer sentiment and spending patterns. Therefore, existing-home sales is an excellent series to analyse as it considers most of the activity in the housing market.

A house represents the biggest purchase item for most. Moreover, people tend to borrow to buy, which would be a factor of sentiment. The series shows existing home sales below its 12-month moving average (green ellipse). The market momentum is also falling, with the stochastic dropping towards its lower quintile (red arrow).
Average Weekly Hours
Unemployment is low, with the U3 definition currently at 3.6%. However, unemployment tends to lag. This delay is because employers tend to lay off employees only after the business cycle has peaked. A more telling series is the number of hours worked, i.e. employers will cut down employees' hours before laying them off.
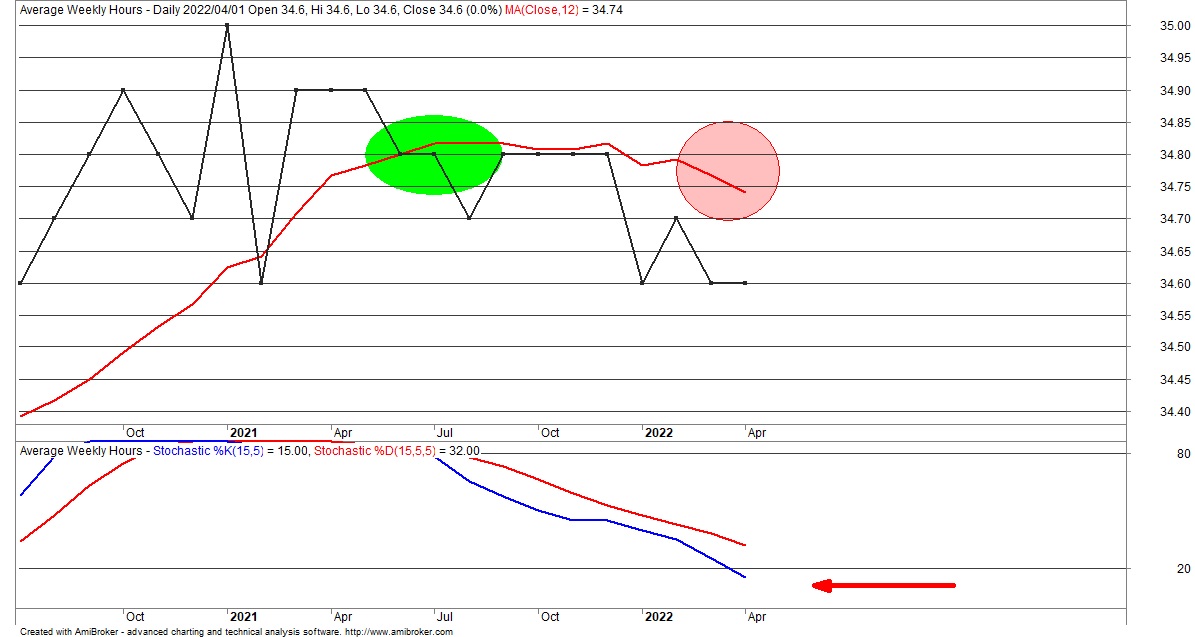
The number of average weekly hours has dipped below its 12-month SMA (green ellipse). Moreover, the SMA has turned down (red ellipse). Finally, we note that the stochastic has also slipped below 20 (red arrow), and if it holds this position, weekly hours will continue to decline. If this carries on, eventually, a threshold will be hit where layoffs become a reality.
Conclusion
The first economic series, light vehicle sales, did have an element of positivity. However, we need more evidence here, e.g. a turning up of its SMA. However, given the state of the other economic series considered, we are not confident this will happen. If anything, the odds suggest that the light-weight vehicle's print is an anomaly or outlier.
The rapid rise of costs has hurt consumers, but so has the increase in rates. As a result, the cost of borrowing is more expensive - for the consumer and employer. These are reflected in the above charts, indicating that the consumer is struggling. Unfortunately, this is set to continues as the Fed battles to contain inflation, and supply shocks wreak havoc. If the consumer cannot find support, GDP risks taking a significant knock. High inflation, coupled with reversals to economic activity; this is stagflation.
References
https://www.ceicdata.com/
investing.com
https://fred.stlouisfed.org/
Image by Clker-Free-Vector-Images from Pixabay

Russell Shor
Senior Market Specialist
Russell Shor joined FXCM in October 2017 as a Senior Market Specialist. He is a certified FMVA® and has an Honours Degree in Economics from the University of South Africa. Russell is a full member of the Society of Technical Analysts in the United Kingdom. With over 20 years of financial markets experience, his analysis is of a high standard and quality.
Any opinions, news, research, analyses, prices, other information, or links to third-party sites contained on this website are provided on an "as-is" basis, as general market commentary and do not constitute investment advice. The market commentary has not been prepared in accordance with legal requirements designed to promote the independence of investment research, and it is therefore not subject to any prohibition on dealing ahead of dissemination. Although this commentary is not produced by an independent source, FXCM takes all sufficient steps to eliminate or prevent any conflicts of interests arising out of the production and dissemination of this communication. The employees of FXCM commit to acting in the clients' best interests and represent their views without misleading, deceiving, or otherwise impairing the clients' ability to make informed investment decisions. For more information about the FXCM's internal organizational and administrative arrangements for the prevention of conflicts, please refer to the Firms' Managing Conflicts Policy. Please ensure that you read and understand our Full Disclaimer and Liability provision concerning the foregoing Information, which can be accessed here.