SPX500 Lacks Firm Direction after Global Growth Downgrades

SPX500 Analysis
Fears over slower growth were reignited, after two international organization slashed their forecasts this week.
The World Bank downgraded its 2022 Global GDP forecast to 2.9%, from 4.1% projected in January and the 5.7% growth in 2021, warning of increasing risk of stagflation, while President Malpass said that a "recession will be hard to avoid" for many countries. US GDP growth is expected to slump to 2.5% in 2022, a significant markdown from the 3.7% previously projected. [1]
The Organisation for Economic Co-operation and Development (OECD) was is similar pessimistic mood, as it projects GDP growth to slow sharply this year to 3%, around 1.5% weaker than projected in the December. The OECD also expects the US economy to grow by 2.5% this year. [2]
Oil prices remain elevated, since markets were unimpressed by last week's OPEC+ decision to boost output by 648,000 barrels per day in July and in August. This keeps inflation fears alive, as markets turn to Friday's US Consumer Price Index update.
Furthermore, Fed officials pressed-on with their hawkish agenda last week, right before the communication blackout period ahead of the July 14-15 policy meeting. The latest high profile commentary had come from come from Ms Mester (voter), right after Friday's solid NFPs.
Speaking on CNBC, the Cleveland Fed president noted that she is "not in that camp" of those who believe tightening should stop in September" and that she could "easily be at 50 basis points in that meeting". [3]
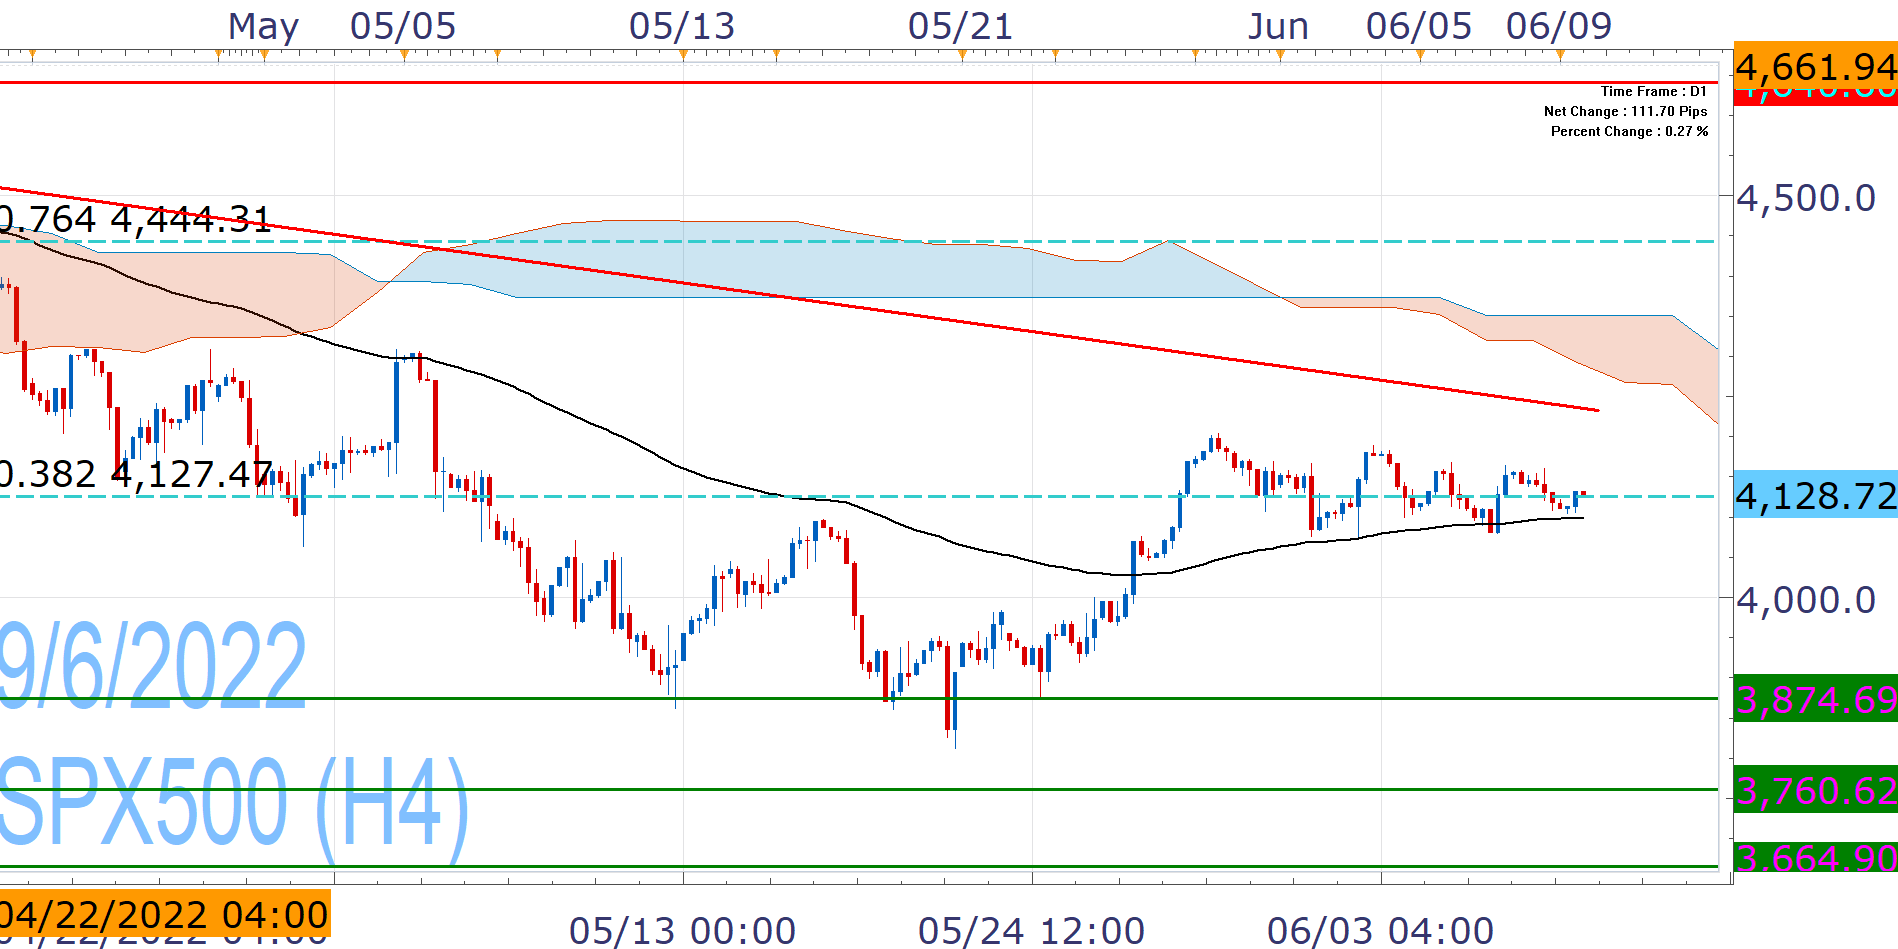
These factors have weighed on the US stock markets and the recent relief-rally of the SPX500, faltered last week, at key technical levels. Over the last several days, it has been lacking firm direction, around the critical 38.2% Fibonacci of the March High/May Low drop.
Its failure to move past this level, creates risk of a resumption of the downtrend that could initially send it towards 4,000, although it may be early to talk of further weakness below 3,784.
On the other hand, the SPX500 has defended the EMA200 so far, which gives it the right push for new monthly highs and look towards descending trendline from the aforementioned high (at around 4,230-40). However we are cautious at this stage regarding its ascending prospects, as the upside seems to contain multiple roadblocks.

Nikos Tzabouras
Senior Financial Editorial Writer
Nikos Tzabouras is a graduate of the Department of International & European Economic Studies at the Athens University of Economics and Business. He has a long time presence at FXCM, as he joined the company in 2011. He has served from multiple positions, but specializes in financial market analysis and commentary.
With his educational background in international relations, he emphasizes not only on Technical Analysis but also in Fundamental Analysis and Geopolitics – which have been having increasing impact on financial markets. He has longtime experience in market analysis and as a host of educational trading courses via online and in-person sessions and conferences.
Any opinions, news, research, analyses, prices, other information, or links to third-party sites contained on this website are provided on an "as-is" basis, as general market commentary and do not constitute investment advice. The market commentary has not been prepared in accordance with legal requirements designed to promote the independence of investment research, and it is therefore not subject to any prohibition on dealing ahead of dissemination. Although this commentary is not produced by an independent source, FXCM takes all sufficient steps to eliminate or prevent any conflicts of interests arising out of the production and dissemination of this communication. The employees of FXCM commit to acting in the clients' best interests and represent their views without misleading, deceiving, or otherwise impairing the clients' ability to make informed investment decisions. For more information about the FXCM's internal organizational and administrative arrangements for the prevention of conflicts, please refer to the Firms' Managing Conflicts Policy. Please ensure that you read and understand our Full Disclaimer and Liability provision concerning the foregoing Information, which can be accessed here.