Rising Yields a Potential Headwind for XAUUSD in 2022

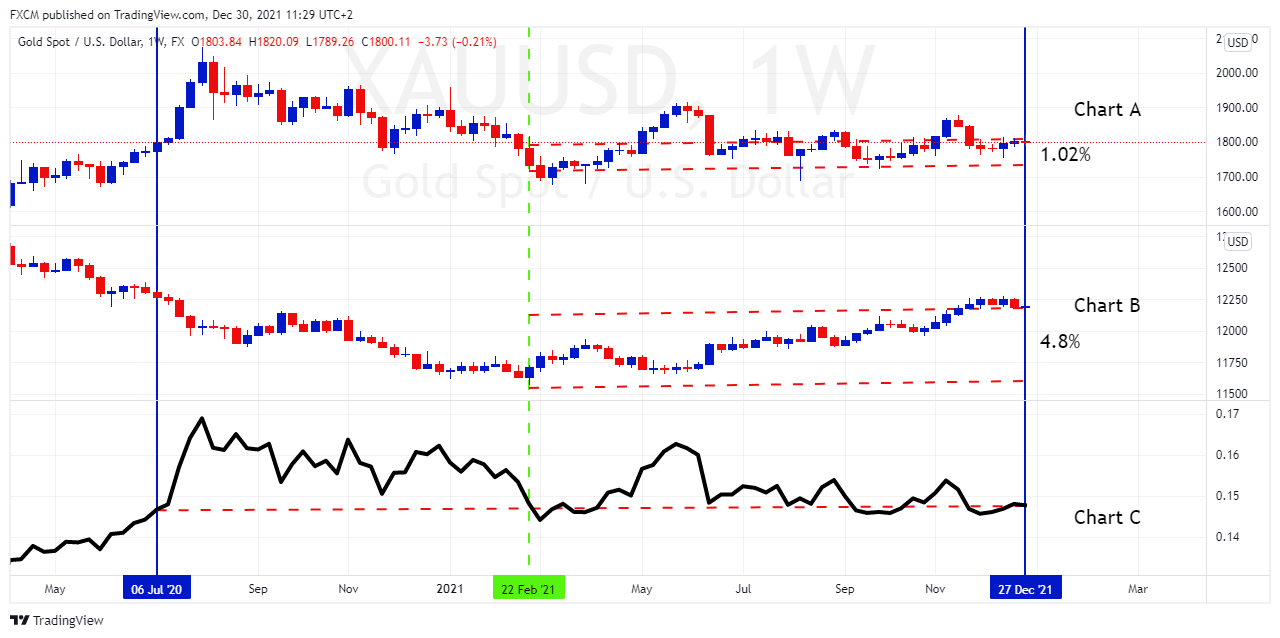
Gold (chart A) has effectively moved sideways on an absolute basis since July 2020 (area between blue verticals). Of interest, this has tracked a similar trajectory for FXCM's USDOLLAR basket (Chart B). As such, and with no surprise, the relative strength ratio (Chart C) between the two reflects neutrality in performance (USDOLLAR has slightly outperformed XAUUSD, as per the positively sloped red dashed line in chart C). The green dashed vertical shows the 2021 low for the FXCM USDOLLAR basket. Since then, the instrument has appreciated by 4.8%, with the gold chart only showing an increase of 1.02%. Given this discrepancy in their respective price changes, one may question the (approximately) neutral performance as per the relative strength line in chart C?
Source: www.tradingview.com
Past Performance: Past Performance is not an indicator of future results.
The ticker for gold is XAU/USD. It is a measure of 1 troy ounce of gold against the greenback. Therefore, the 1.02% reflects changes in both the numerator and the denominator. I.e., given the surge in the greenback (denominator) from the green dashed vertical, gold's intrinsic value as per the numerator has changed positively to the degree that relative performance has been approximately equal. However, yesterday's article suggests that the US10Y is turning bullish into the new year, which is dollar-supportive. If this is true, will the numerator in the XAU/USD ratio keep up so that the relative performance remains neutral? Of importance here is the fact that gold has no income yield. This makes little difference in a low-interest-rate environment. However, given that yields are likely to move up in 2022, the opportunity cost of holding gold as opposed to income-paying bonds will increase as well. The rate of change in yields will also be a factor. As such, the numerator, XAU, is exposed to headwinds. This suggests that the relative strength, as per chart C, may increase its gradient to the upside as the USDOLLAR pulls away and outperforms the precious metal next year.
Featured Image by Steve Bidmead from Pixabay

Russell Shor
Senior Market Specialist
Russell Shor joined FXCM in October 2017 as a Senior Market Specialist. He is a certified FMVA® and has an Honours Degree in Economics from the University of South Africa. Russell is a full member of the Society of Technical Analysts in the United Kingdom. With over 20 years of financial markets experience, his analysis is of a high standard and quality.
Any opinions, news, research, analyses, prices, other information, or links to third-party sites contained on this website are provided on an "as-is" basis, as general market commentary and do not constitute investment advice. The market commentary has not been prepared in accordance with legal requirements designed to promote the independence of investment research, and it is therefore not subject to any prohibition on dealing ahead of dissemination. Although this commentary is not produced by an independent source, FXCM takes all sufficient steps to eliminate or prevent any conflicts of interests arising out of the production and dissemination of this communication. The employees of FXCM commit to acting in the clients' best interests and represent their views without misleading, deceiving, or otherwise impairing the clients' ability to make informed investment decisions. For more information about the FXCM's internal organizational and administrative arrangements for the prevention of conflicts, please refer to the Firms' Managing Conflicts Policy. Please ensure that you read and understand our Full Disclaimer and Liability provision concerning the foregoing Information, which can be accessed here.