Real rates are acting peculiarly, making NAS100 analysis difficult

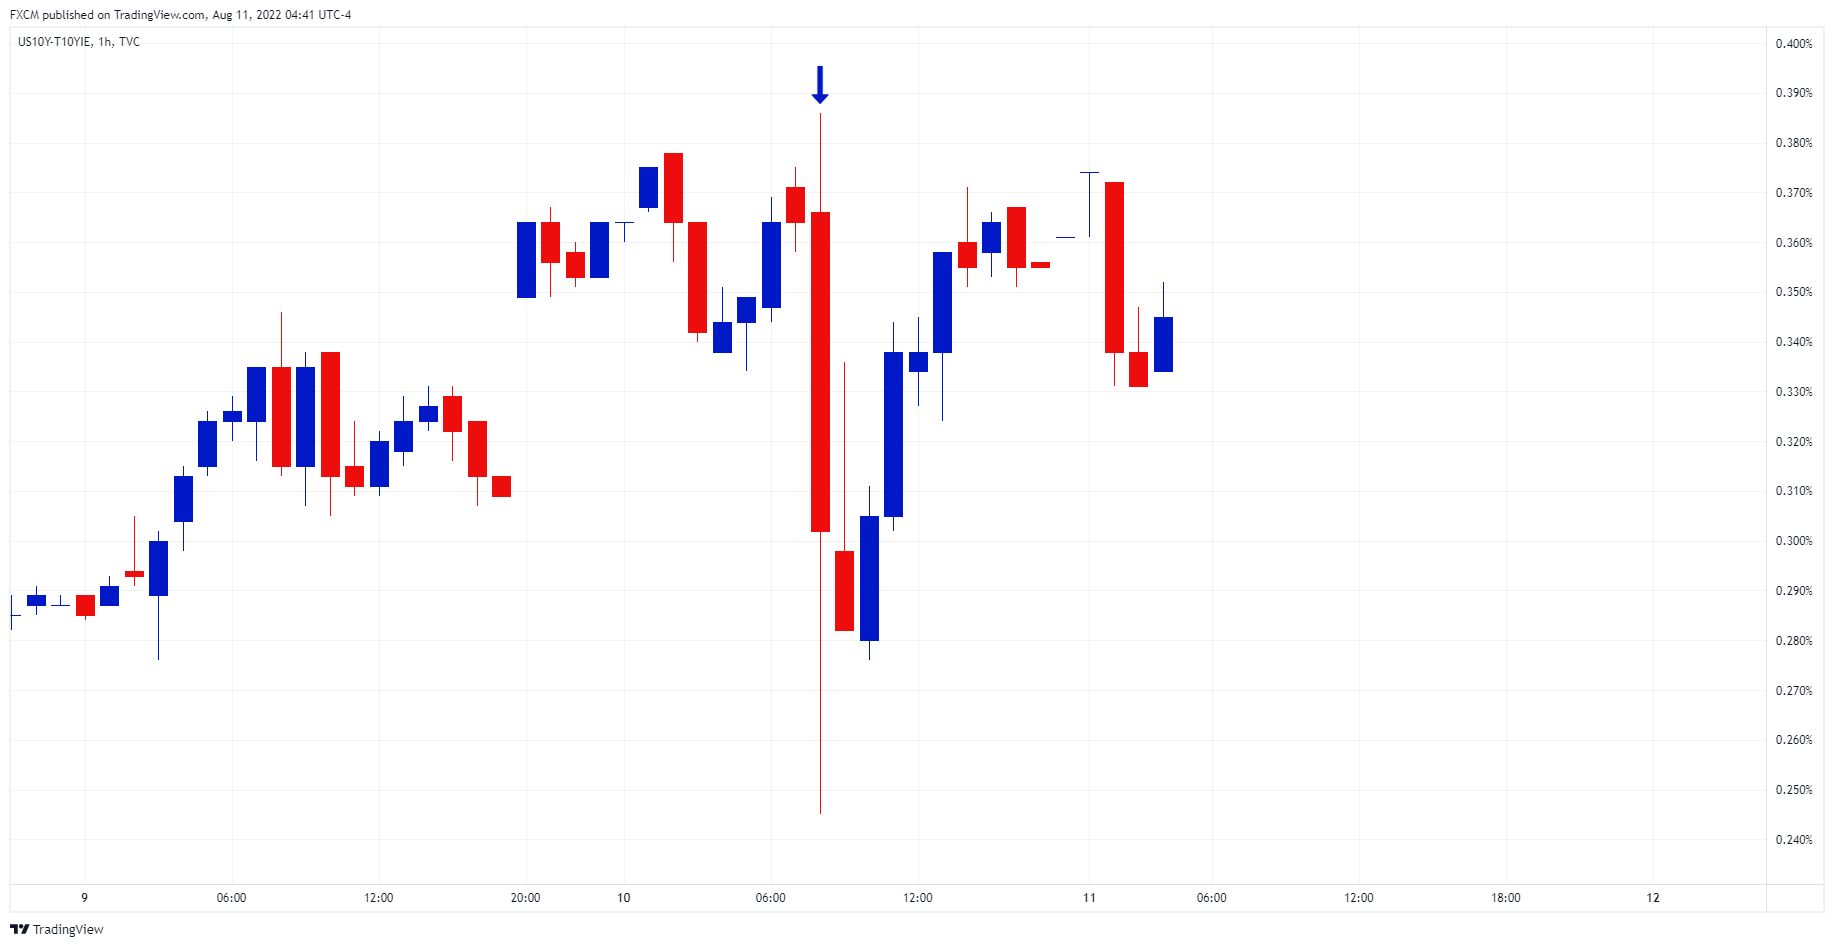
Short-term real interest rate reaction
Source: www.tradingview.com
After yesterday's CPI release showed some moderation, real rates declined (down blue arrow). However, this drop was temporary, and the market faded the move. I.e. activity supported the dip with real rates moving back to pre-announcement levels.
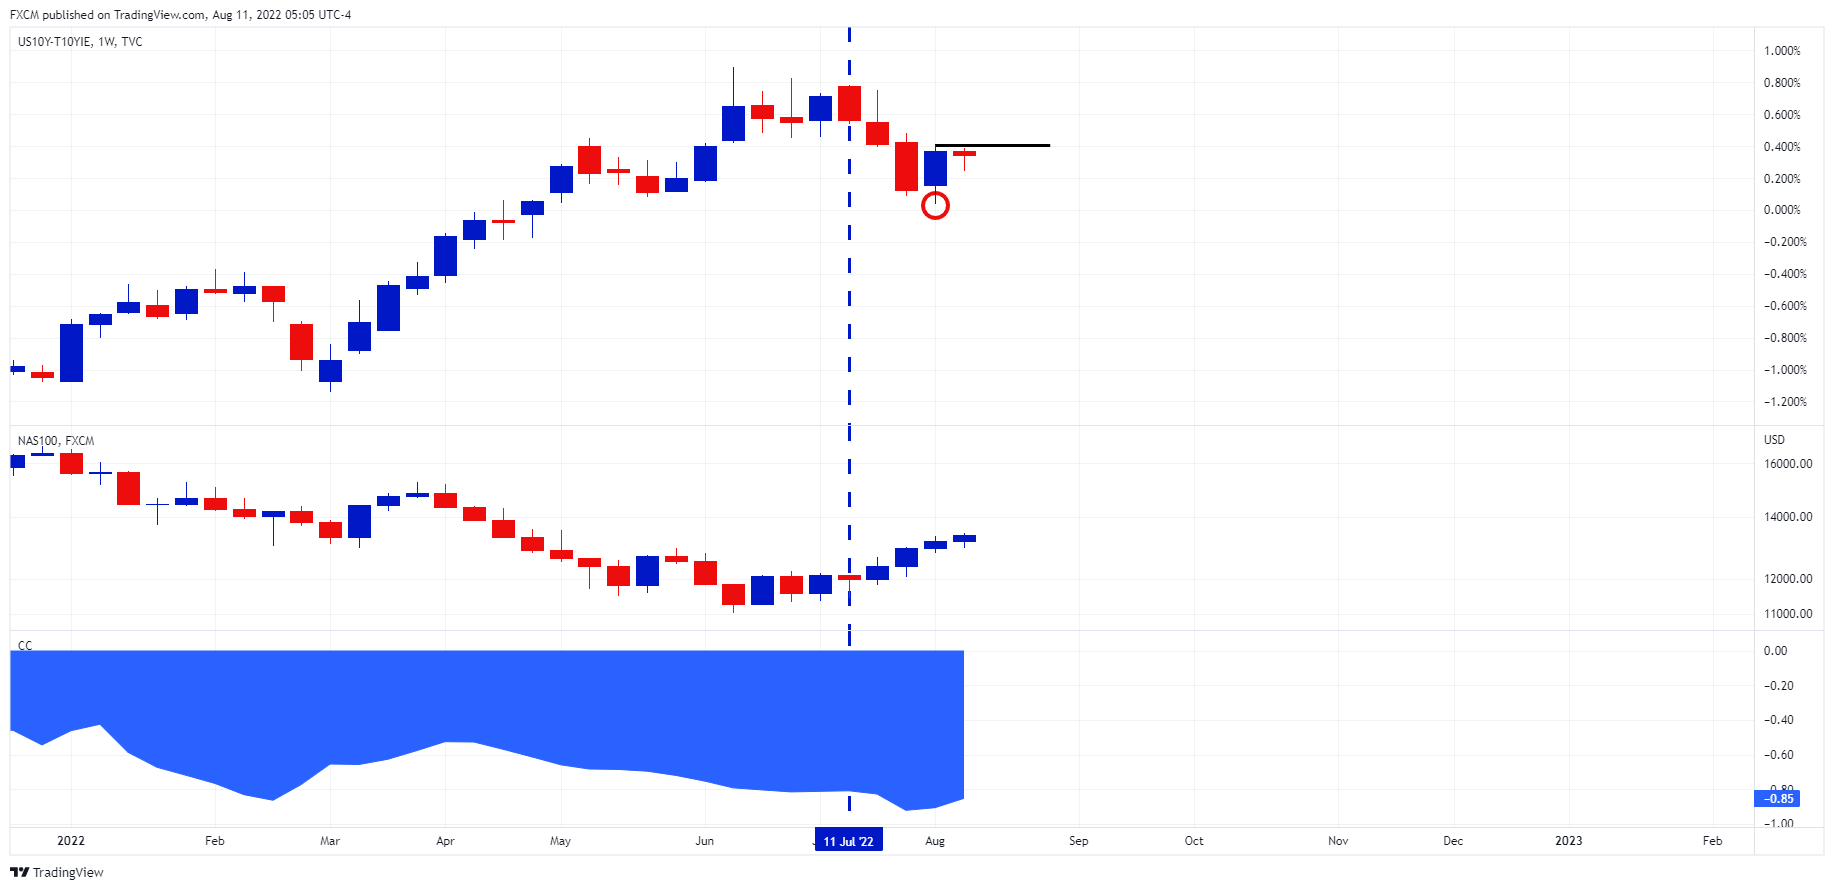
Longer-term real rate analysis and its correlation to NAS100
Source: www.tradingview.com
The weekly real rate has pulled back since the week of July 11 (blue dashed vertical). Current price action makes for interesting analysis. A reference candle may have charted (red circle) - a candle with a higher low to either side. If the price closes above the reference candle's high, a potential trough is in play. This pattern implies a platform for higher real rates.
The moderation in inflation suggests that higher real rates face headwinds, leading to the initial sell-off as indicated above. However, as the market faded the sell-down, the potential trough scenario remains a possibility. In this regard, we note:
- Real rates have an inverse correlation to the rate-sensitive NAS100.
- The correlation coefficient is a strong -0.85 (bottom indicator).
The NAS100 rose after the CPI release. However, an anomaly occurred by the NAS100 not following the fading of the real rate given the correlation coefficient. The NAS100 closed 2.5% up on the day. This irregularity makes for complex analysis. Either the NAS100 will decline due to the real rate's price action or vice versa. This assessment is because the NAS100's inherent time value of money characteristics will not allow it to shake the influences of real rates for long.

Russell Shor
Senior Market Specialist
Russell Shor joined FXCM in October 2017 as a Senior Market Specialist. He is a certified FMVA® and has an Honours Degree in Economics from the University of South Africa. Russell is a full member of the Society of Technical Analysts in the United Kingdom. With over 20 years of financial markets experience, his analysis is of a high standard and quality.
Any opinions, news, research, analyses, prices, other information, or links to third-party sites contained on this website are provided on an "as-is" basis, as general market commentary and do not constitute investment advice. The market commentary has not been prepared in accordance with legal requirements designed to promote the independence of investment research, and it is therefore not subject to any prohibition on dealing ahead of dissemination. Although this commentary is not produced by an independent source, FXCM takes all sufficient steps to eliminate or prevent any conflicts of interests arising out of the production and dissemination of this communication. The employees of FXCM commit to acting in the clients' best interests and represent their views without misleading, deceiving, or otherwise impairing the clients' ability to make informed investment decisions. For more information about the FXCM's internal organizational and administrative arrangements for the prevention of conflicts, please refer to the Firms' Managing Conflicts Policy. Please ensure that you read and understand our Full Disclaimer and Liability provision concerning the foregoing Information, which can be accessed here.