NAS100 Subdued in the Aftermath of Snap’s Profit Warning

Snap's Profit Warning
In the fourth quarter of the last year, the social media and messaging firm had managed to turn in profits for the first time since it went public, with a Net Income of $23 million, but things deteriorated from then on. [1]
In the latest financial results in April for Q1, Snap slipped back to a Net Loss of roughly $360 million, Adjusted EBITDA dropped to $64.468 million from $326.793 million in Q4 and Revenues slid to $1.062 billion, from nearly $1.3 billion in Q4. [2]
The forward guidance for Q2 was not particularly encouraging either, since the company had projected Adjusted Earnings (EBITDA) to be between breakeven and $50 million, while Revenues were expected to grow 20%-25% year-over-year, which would bring them above $1.113 billion.
However, Snap posted a Revenue and Earnings warning on Tuesday, on its 8-K filing with the US Securities and Exchange Commission (SEC). Based on the document, the company now believes that its Revenue and adjusted Earnings (EBITDA) will miss the low end of its Q2 2022 guidance range. [3]
The company cited a macroeconomic environment that "has deteriorated further and faster than anticipated" as the reason for this downgrade, but remains "excited" about the long-term opportunity to grow its business.
Market Reaction
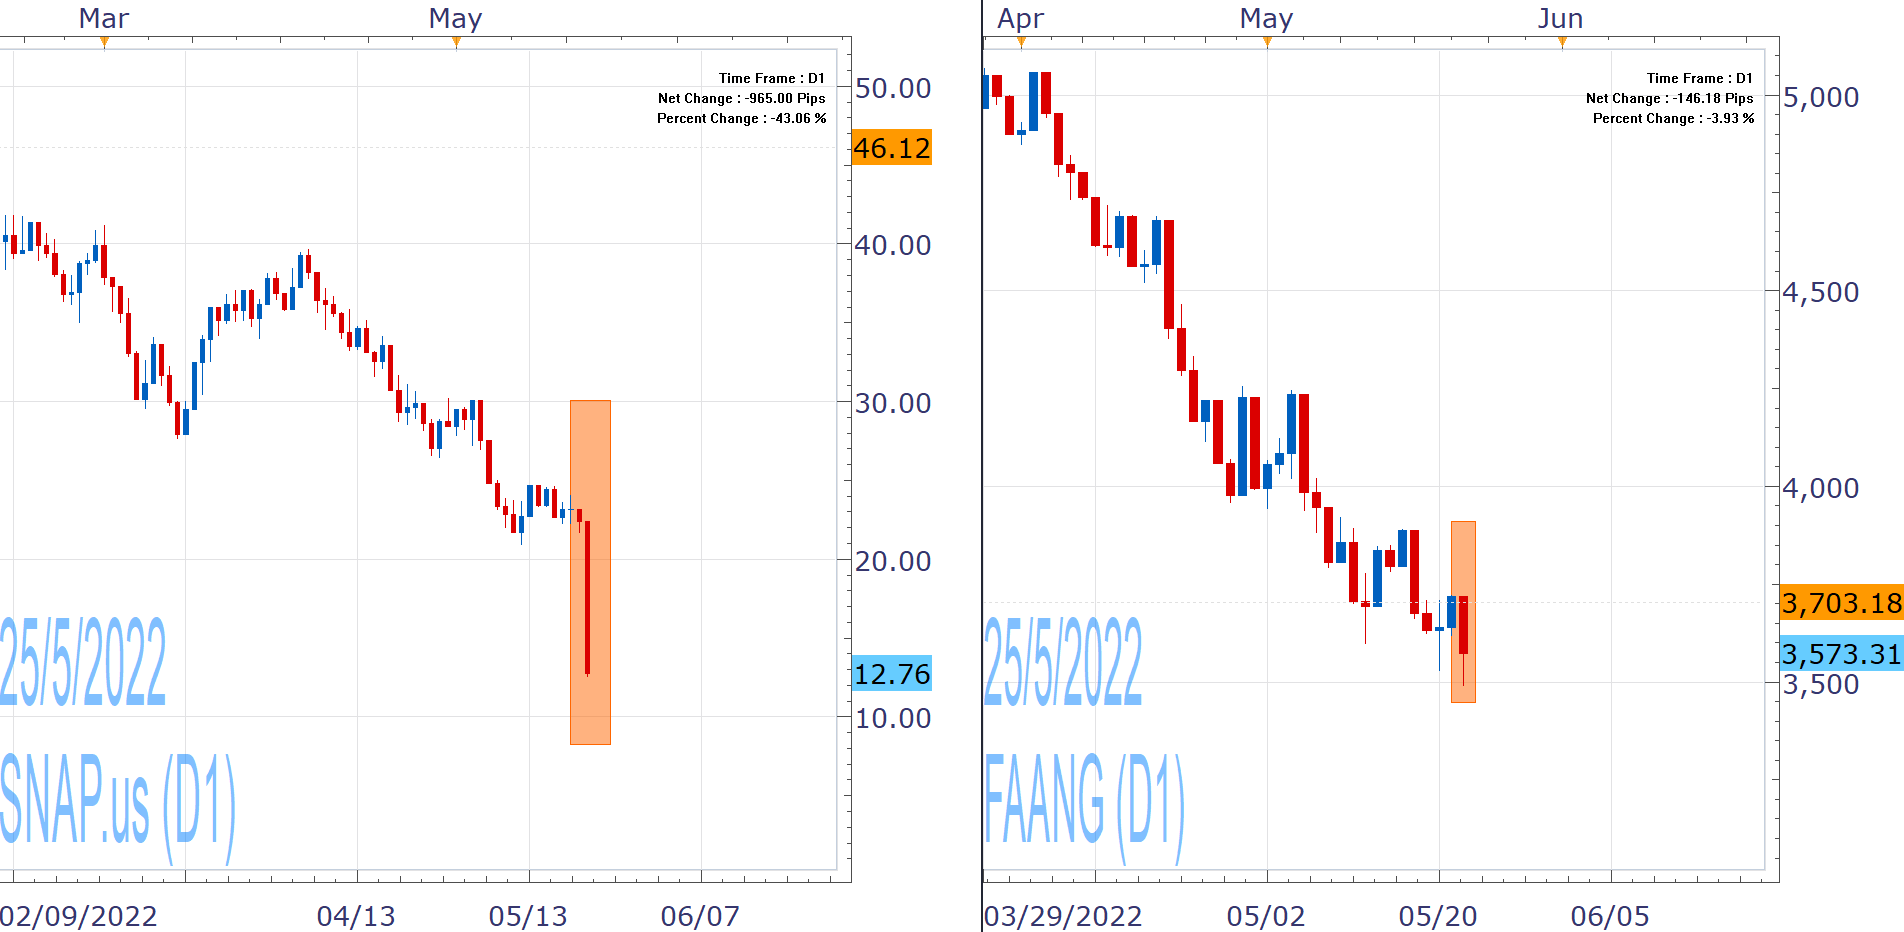
SNAP.us collapsed to two-year lows on Tuesday after the profit warning and closed the day with losses in excess of 40%. This dragged social media giant Meta (Facebook) down, as FB.us lost more than 7%, while FXCM's FAANG Stock Basket, which includes Facebook and other tech heavyweights, dropped around 4%.
Companies such as Snap, which is not profitable, are particularly vulnerable to the current high inflation and high interest rates environment, while the broader tech sector also reels under these conditions and risk aversion stemming from stagflation fears and other factors.
NAS100 Analysis
A look in the NAS100 is telling, since it trades firmly in bear territory, losing around 30% from its November record high at the time of writing, while erasing nearly 50% of its rally form the pandemic lows to the aforementioned high.
The broader SPX500 for reference, is also having a bad year and had registered its worst day in 2+ years last week, but has managed to avoid bear market so far, losing less than 20% from its January all-time highs at the time of writing.
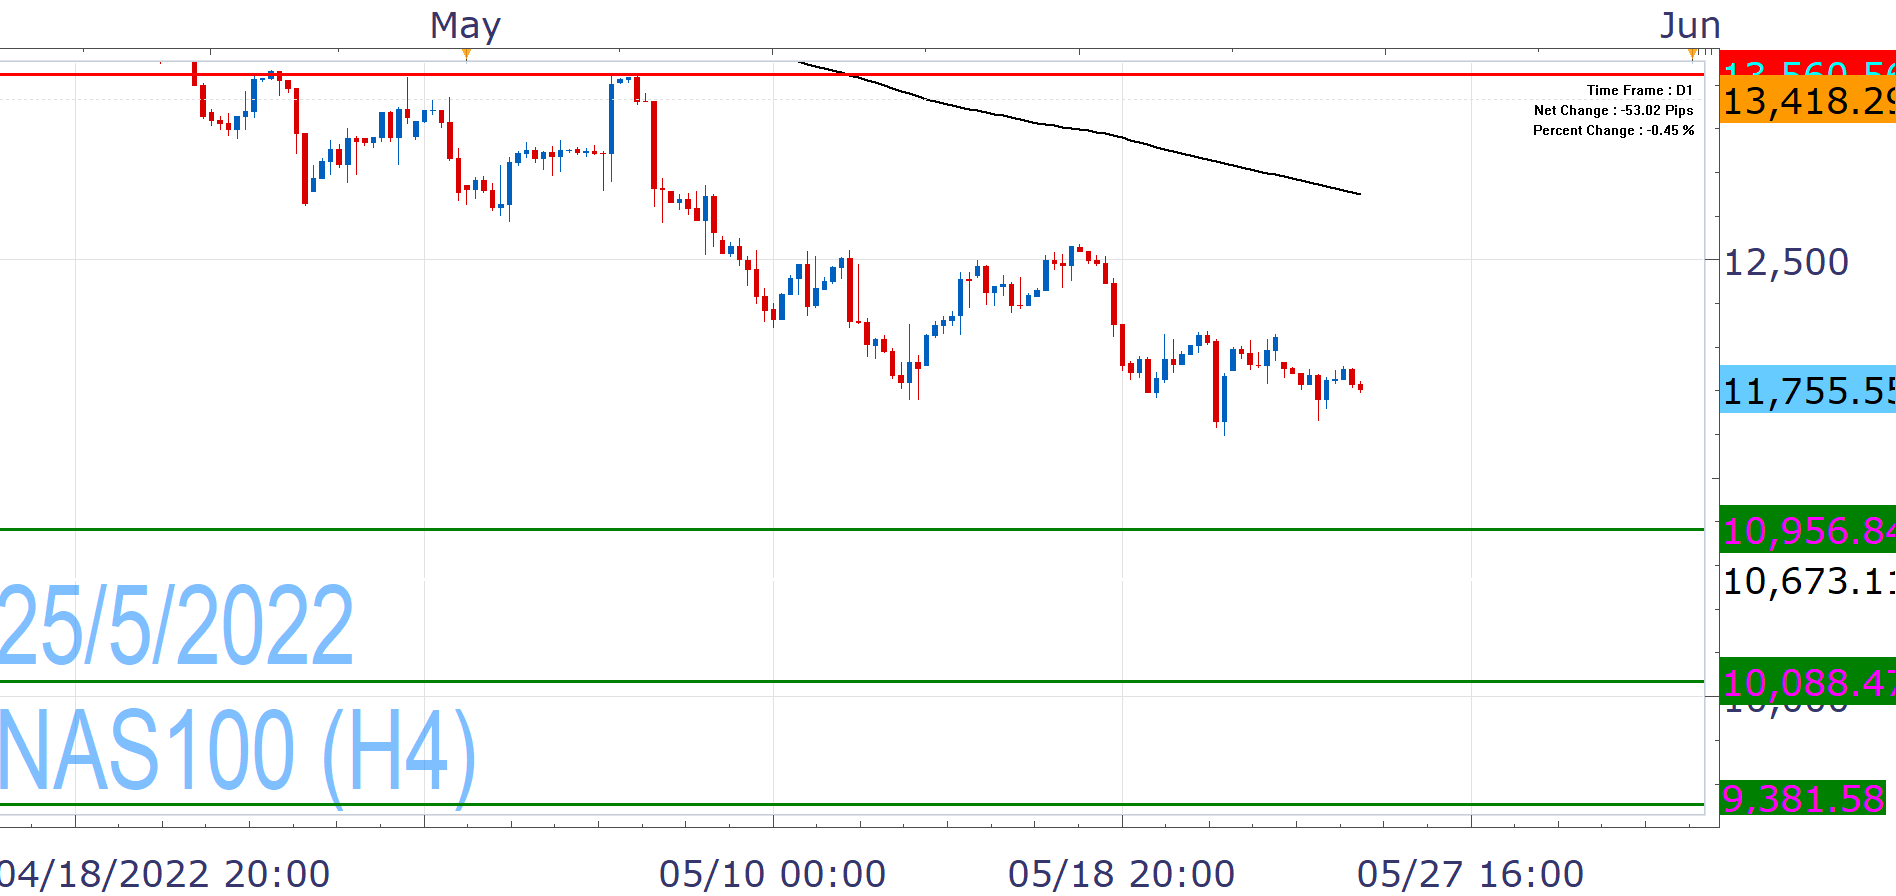
NAS100 remains subdued today, after yesterday's drop, running its eighth straight negative week. On Friday, it had registered its lowest levels since late-2020 and is in risk of fresh lows towards 10,956, but we are not sure if bears are ready to challenge this area and look towards 10,088.
Despite the negative undertone, the index tries to take a breath and a rebound towards mid-12,000 would not be surprising, but risk-on sentiment would be required for further recovery and we struggle to see what could lead towards the EMA200 (12,900) at this stage.

Nikos Tzabouras
Senior Financial Editorial Writer
Nikos Tzabouras is a graduate of the Department of International & European Economic Studies at the Athens University of Economics and Business. He has a long time presence at FXCM, as he joined the company in 2011. He has served from multiple positions, but specializes in financial market analysis and commentary.
With his educational background in international relations, he emphasizes not only on Technical Analysis but also in Fundamental Analysis and Geopolitics – which have been having increasing impact on financial markets. He has longtime experience in market analysis and as a host of educational trading courses via online and in-person sessions and conferences.
References
| Retrieved 25 May 2022 https://s25.q4cdn.com/442043304/files/doc_financials/2021/q4/Q4'21-Earnings-Release.pdf | |
| Retrieved 25 May 2022 https://s25.q4cdn.com/442043304/files/doc_financials/2022/q1/Q1-2022-Earnings-Release.pdf | |
| Retrieved 25 Apr 2024 https://d18rn0p25nwr6d.cloudfront.net/CIK-0001564408/d7bf1c16-b7a7-4e90-942b-169f17cc954a.pdf |
Any opinions, news, research, analyses, prices, other information, or links to third-party sites contained on this website are provided on an "as-is" basis, as general market commentary and do not constitute investment advice. The market commentary has not been prepared in accordance with legal requirements designed to promote the independence of investment research, and it is therefore not subject to any prohibition on dealing ahead of dissemination. Although this commentary is not produced by an independent source, FXCM takes all sufficient steps to eliminate or prevent any conflicts of interests arising out of the production and dissemination of this communication. The employees of FXCM commit to acting in the clients' best interests and represent their views without misleading, deceiving, or otherwise impairing the clients' ability to make informed investment decisions. For more information about the FXCM's internal organizational and administrative arrangements for the prevention of conflicts, please refer to the Firms' Managing Conflicts Policy. Please ensure that you read and understand our Full Disclaimer and Liability provision concerning the foregoing Information, which can be accessed here.