MSFT Is Overbought But Fundamentals Make Pullbacks Compelling
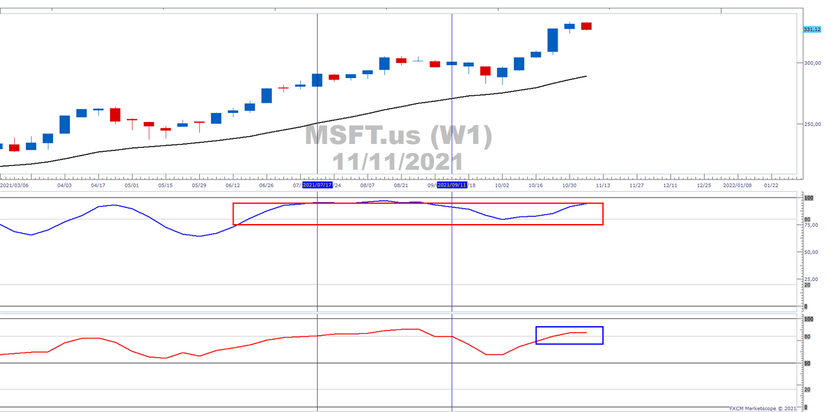
The MSFT weekly chart is overbought (blue rectangle). At some stage, the RSI will need to normalise. However, weekly conditions are tricky because it may take weeks or even months before correcting. The last overbought condition took two months before clearing (blue verticals). The stochastic has also been showing tremendous strength and has been in the upper region since mid-June (red rectangle).
Past Performance: Past Performance is not an indicator of future results.
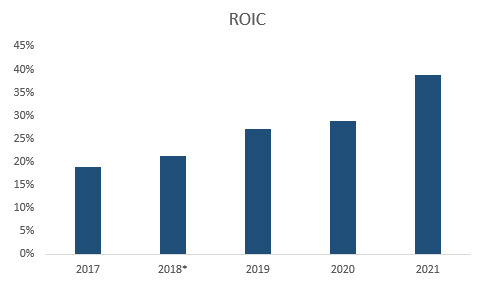
MSFT became the world's most valuable company in the last week of October. It has scored particularly well with terrific sales for its cloud division. It has a 21% share of the cloud market. On a PE basis, it is relatively expensive at 37.01 vs 29.05 for the SPX. However, its ROIC histogram shows strong performance over the last 5 years (based on NOPAT, PP&E, and net working capital).
If the share price corrects, relieving some of the pressure on the RSI and its PE, the strong ROIC is likely to make it compelling at support.
*we adjusted MSFT's NOPAT for 2018 due to an unusally large tax expense.
References:
https://finance.yahoo.com/
https://www.sec.gov/
https://www.wsj.com/

Russell Shor
Senior Market Specialist
Russell Shor joined FXCM in October 2017 as a Senior Market Specialist. He is a certified FMVA® and has an Honours Degree in Economics from the University of South Africa. Russell is a full member of the Society of Technical Analysts in the United Kingdom. With over 20 years of financial markets experience, his analysis is of a high standard and quality.
Any opinions, news, research, analyses, prices, other information, or links to third-party sites contained on this website are provided on an "as-is" basis, as general market commentary and do not constitute investment advice. The market commentary has not been prepared in accordance with legal requirements designed to promote the independence of investment research, and it is therefore not subject to any prohibition on dealing ahead of dissemination. Although this commentary is not produced by an independent source, FXCM takes all sufficient steps to eliminate or prevent any conflicts of interests arising out of the production and dissemination of this communication. The employees of FXCM commit to acting in the clients' best interests and represent their views without misleading, deceiving, or otherwise impairing the clients' ability to make informed investment decisions. For more information about the FXCM's internal organizational and administrative arrangements for the prevention of conflicts, please refer to the Firms' Managing Conflicts Policy. Please ensure that you read and understand our Full Disclaimer and Liability provision concerning the foregoing Information, which can be accessed here.