Meta Fundamentals Have Improved But Look Stretched at Current Price
Facebook announced on 28 October that it had changed its name to Meta Platforms. Please note that the stock ticker will change from FB to MVRS, effective 1 December. The company is currently trading at a PE of 24.4. This is lower than the Nasdaq multiple of 36.08.

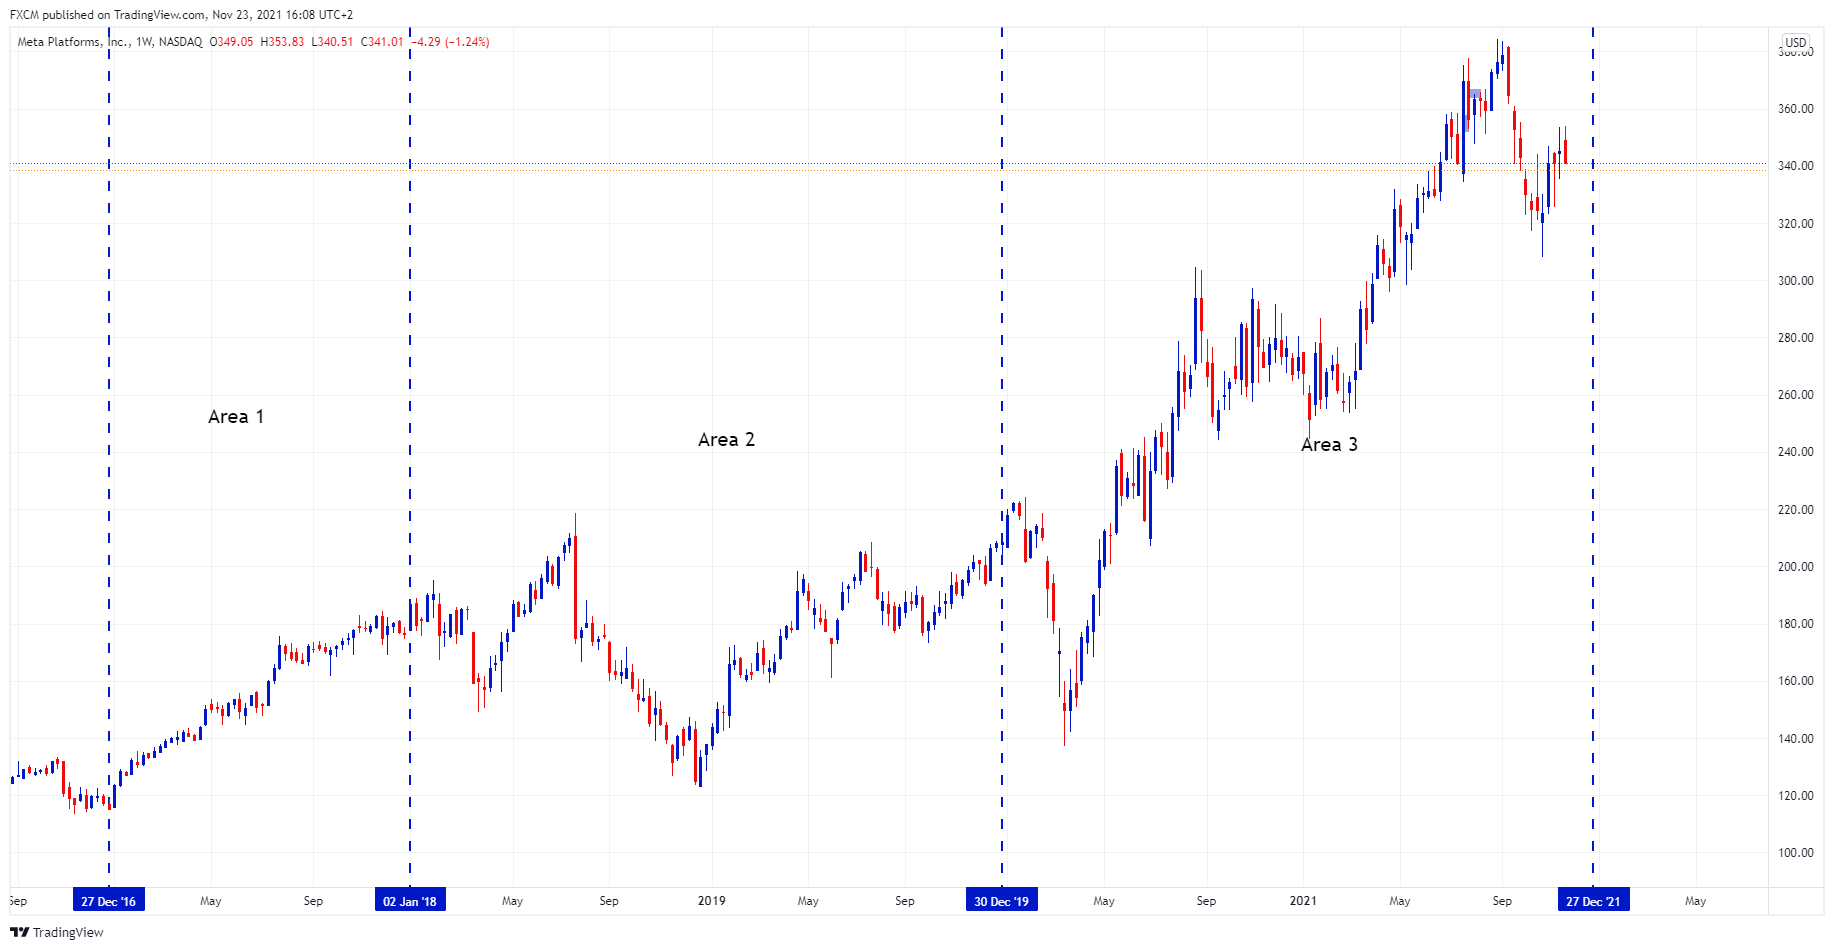
Past Performance: Past Performance is not an indicator of future results.
The histogram denotes the company's ROIC (calculated using NOPAT, net PP&E and working capital elements).
Past Performance: Past Performance is not an indicator of future results.
Source: www.tradingview.com
Our calculated ROIC for the fiscal year 2017 is an impressive 87%. Area 1 is the area of the company's price chart that aligns with this ROIC. The stock price appreciated by near 52% during this time period. However, the ROIC dropped over the next 2 years; as does FB's revenue growth (orange line). This period aligns with area 2 in the company's price chart. It is a volatile period, and although 2018 was a down year, area 2 manages to gain about 11%.
Area 3 includes the pandemic period. FB's ROIC improved and revenue growth picked up. We note that the last histogram period is a forecast based on the "trailing twelve months." Nevertheless, we do anticipate an improved ROIC and revenue growth for this period. If correct, this suggests that Meta may be in a position to build future economic value for its shareholders.
However, current price levels may be too expensive. Including the forecasted TTM results, the average growth rate in the free cash flow over the past 5 years has been about 22%. The mean stock appreciation per annum for the same period is close to 27%. Using the TTM's FCF, applying the 22% growth and using a 27% required rate of return, the terminal value is $873.72bn, against a market cap $948.61bn. This suggests Meta stock may be stretched at current levels. Considered with the anticipated improvement in ROIC and revenue growth, pullbacks may very well be compelling and supported by market particpants.
Additional sources:
https://finance.yahoo.com/quote/FB/financials?p=FB

Russell Shor
Senior Market Specialist
Russell Shor joined FXCM in October 2017 as a Senior Market Specialist. He is a certified FMVA® and has an Honours Degree in Economics from the University of South Africa. Russell is a full member of the Society of Technical Analysts in the United Kingdom. With over 20 years of financial markets experience, his analysis is of a high standard and quality.
Any opinions, news, research, analyses, prices, other information, or links to third-party sites contained on this website are provided on an "as-is" basis, as general market commentary and do not constitute investment advice. The market commentary has not been prepared in accordance with legal requirements designed to promote the independence of investment research, and it is therefore not subject to any prohibition on dealing ahead of dissemination. Although this commentary is not produced by an independent source, FXCM takes all sufficient steps to eliminate or prevent any conflicts of interests arising out of the production and dissemination of this communication. The employees of FXCM commit to acting in the clients' best interests and represent their views without misleading, deceiving, or otherwise impairing the clients' ability to make informed investment decisions. For more information about the FXCM's internal organizational and administrative arrangements for the prevention of conflicts, please refer to the Firms' Managing Conflicts Policy. Please ensure that you read and understand our Full Disclaimer and Liability provision concerning the foregoing Information, which can be accessed here.