Market participants turn attention to tomorrow’s inflation release

Tomorrow sees the release of the much anticipated CPI prints for May. Naturally, we are interested in the core CPI number as this generally represents the demand side of the economy and will allow us to make inferences regarding Fed monetary policy going forward. It's important to note that the Fed regards the core PCE for its policy decisions. However, the two series have a close correlation.
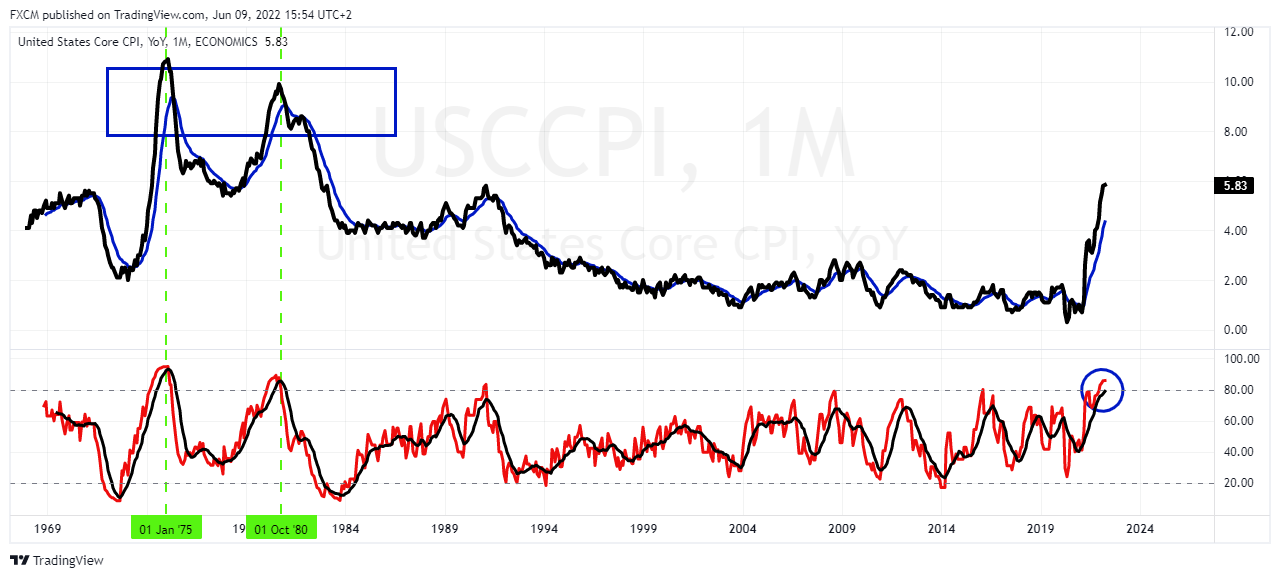
The below chart shows core CPI YoY from the late 1960s. We draw parallels between our current inflationary environment and the first and second oil crises of the 1970s (blue rectangle). Interestingly, these periods are all characterised by an overbought RSI in terms of technical analysis.
Source: www.tradingview.com
The market is looking to see if inflation has peaked. This chart will help. We have drawn two green dashed verticals where the RSI crosses below a black signal line. Shortly after that, the core CPI crosses below its blue 12-month EMA.
Using similar reasoning, we watch the current RSI and its black signal line (blue ellipse) and await a negative cross. If this happens over the subsequent CPI releases, the next signal, suggesting that inflation is moderating, will be the core CPI series below its blue EMA.

Russell Shor
Senior Market Specialist
Russell Shor joined FXCM in October 2017 as a Senior Market Specialist. He is a certified FMVA® and has an Honours Degree in Economics from the University of South Africa. Russell is a full member of the Society of Technical Analysts in the United Kingdom. With over 20 years of financial markets experience, his analysis is of a high standard and quality.
Any opinions, news, research, analyses, prices, other information, or links to third-party sites contained on this website are provided on an "as-is" basis, as general market commentary and do not constitute investment advice. The market commentary has not been prepared in accordance with legal requirements designed to promote the independence of investment research, and it is therefore not subject to any prohibition on dealing ahead of dissemination. Although this commentary is not produced by an independent source, FXCM takes all sufficient steps to eliminate or prevent any conflicts of interests arising out of the production and dissemination of this communication. The employees of FXCM commit to acting in the clients' best interests and represent their views without misleading, deceiving, or otherwise impairing the clients' ability to make informed investment decisions. For more information about the FXCM's internal organizational and administrative arrangements for the prevention of conflicts, please refer to the Firms' Managing Conflicts Policy. Please ensure that you read and understand our Full Disclaimer and Liability provision concerning the foregoing Information, which can be accessed here.