Gold short-term analysis – 04 April 2023

Source: www.tradingview.com
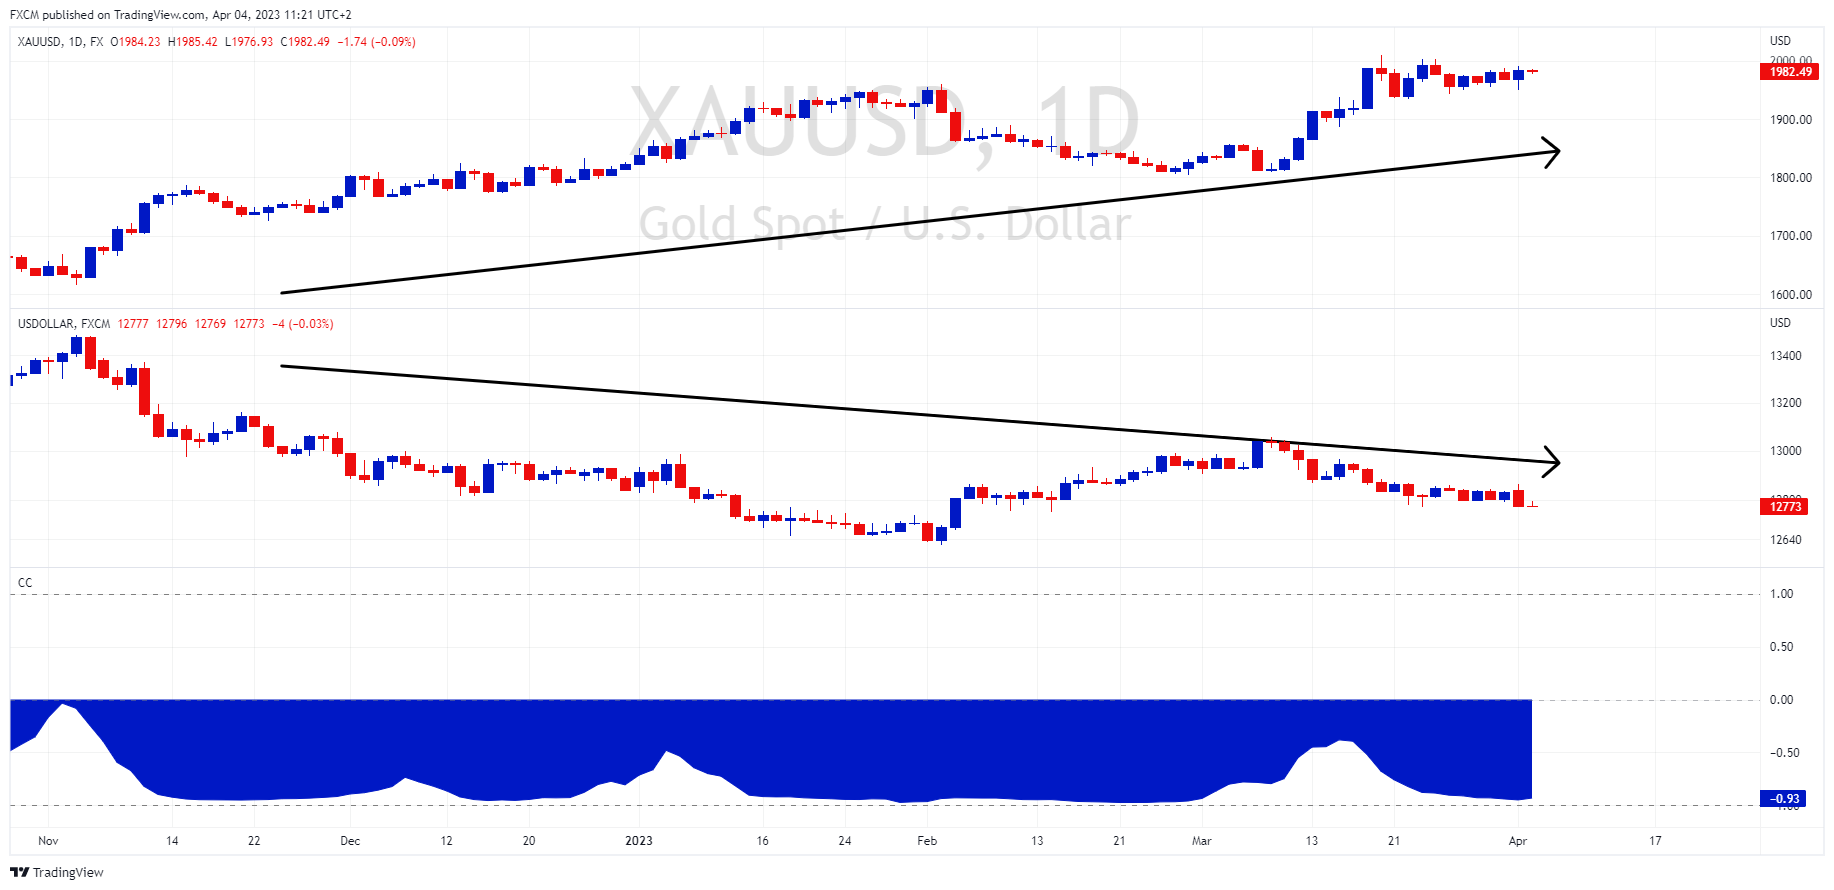
Further to our USDOLLAR article, we note that the gold daily chart has a strong inverse correlation to the USDOLLAR. The correlation coefficient between the two is a hardy -93%. I.e., gold is benefitting as the greenback comes under pressure.

The daily chart on the left, shows gold trading in its bullish channel between the upper blue and red bands. Moreover, its RSI is above 50 (green rectangle). The longer it maintains the bullish side of 50, the stronger the probability of further price appreciation.
The hourly chart on the right also has bullish signs. Its trend-following EMAs and momentum-based stochastic have crossed up (black ellipses). If the stochastic is able to make its way to the 80+ levels and hold (blue arrow), the hourly chart will be running with an underlying bullish momentum.

Russell Shor
Senior Market Specialist
Russell Shor joined FXCM in October 2017 as a Senior Market Specialist. He is a certified FMVA® and has an Honours Degree in Economics from the University of South Africa. Russell is a full member of the Society of Technical Analysts in the United Kingdom. With over 20 years of financial markets experience, his analysis is of a high standard and quality.
Any opinions, news, research, analyses, prices, other information, or links to third-party sites contained on this website are provided on an "as-is" basis, as general market commentary and do not constitute investment advice. The market commentary has not been prepared in accordance with legal requirements designed to promote the independence of investment research, and it is therefore not subject to any prohibition on dealing ahead of dissemination. Although this commentary is not produced by an independent source, FXCM takes all sufficient steps to eliminate or prevent any conflicts of interests arising out of the production and dissemination of this communication. The employees of FXCM commit to acting in the clients' best interests and represent their views without misleading, deceiving, or otherwise impairing the clients' ability to make informed investment decisions. For more information about the FXCM's internal organizational and administrative arrangements for the prevention of conflicts, please refer to the Firms' Managing Conflicts Policy. Please ensure that you read and understand our Full Disclaimer and Liability provision concerning the foregoing Information, which can be accessed here.