Gold Mixed at Key Technical Levels, after Stopping its 5-Week Losing Streak

XAU/USD Analysis
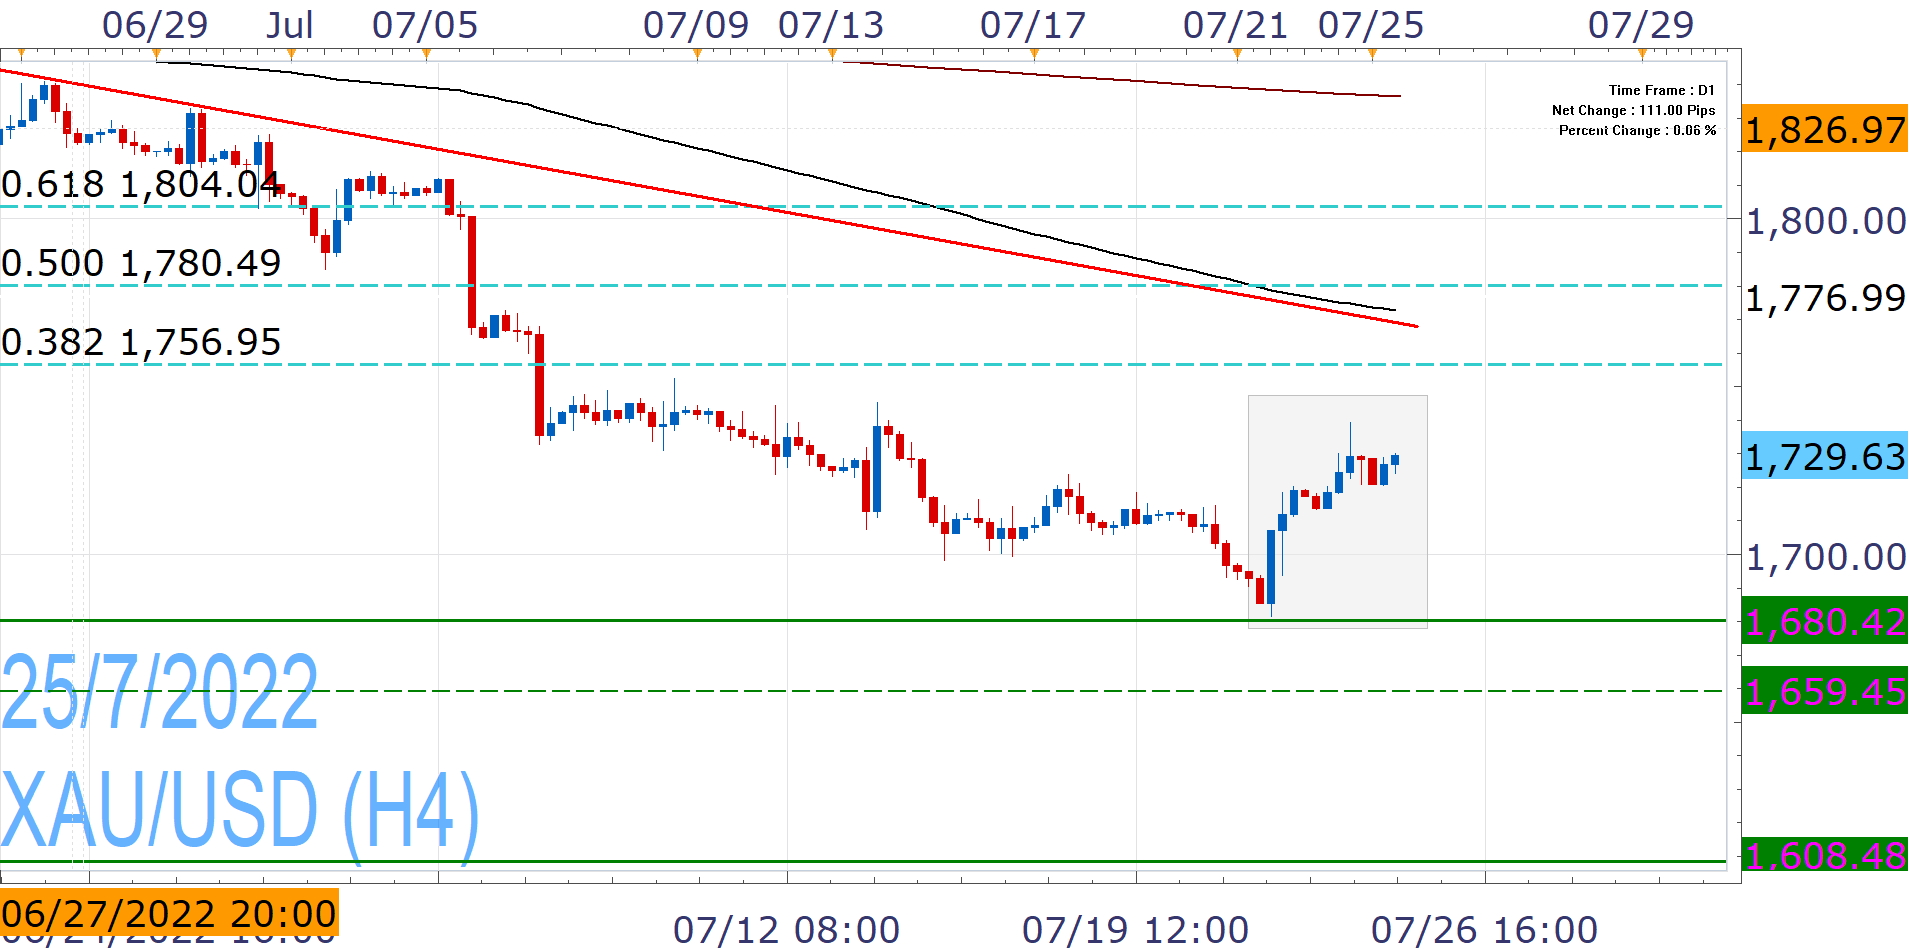
The precious metal dropped to 16-month lows last week at 1,680, but defended once again a known support area and managed to post a relief rally from there, which led it to its first profitable week in more than a month.
This rebound gives it the ability to move for the 38.2% Fibonacci of the June High/July Low decline (1,756), but it does not inspire much confidence for more, at this stage. The broader 1,768-1,780 region poses a significant technical roadblock that will need a strong catalyst, in order to be surpassed.
It contains the 50% Fibonacci, the EMA200 and the descending trendline from last month's high, although a successful effort could lead to a sustained recovery.
On the other hand, XAU/USD is not out of the woods yet, and renewed pressure towards 1,680 is still in play, but it is early to talk about a drop below 1,659.
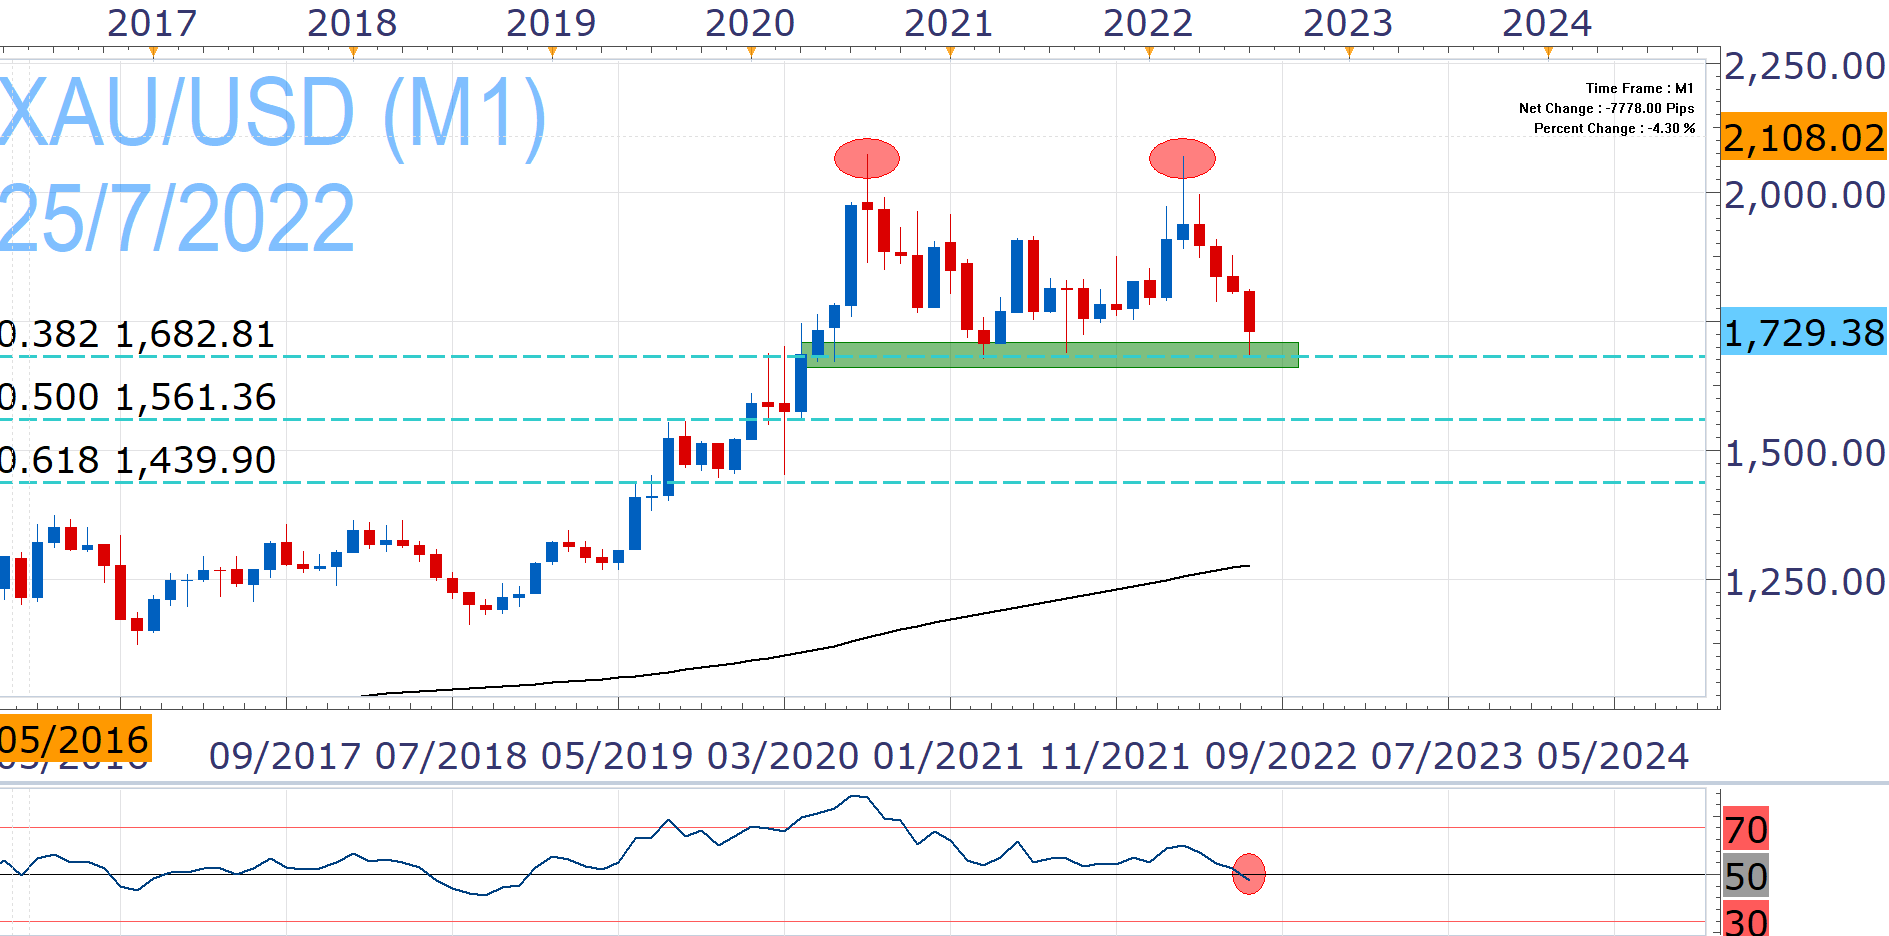
Despite the aforementioned recovery, XAU/USD remains in a tough spot, since the medium and long term outlook are difficult and will need USD weakness in order to achieve a sustained advance. A look at the monthly chart highlights the downside risks.
Gold managed to hold the key 1,669-1,682 area that can provide the basis for a recovery, but the Relative Strength Index (RSI) moves below the 50 mark, which has not happened since 2018, pointing to further weakness before a bottom can be formed.
A more ominous sign, albeit with a high degree of difficulty, is the Double-Tops, which could potentially open the door to a broader decline, if the 1,669-1,680 support gives way.

Nikos Tzabouras
Senior Financial Editorial Writer
Nikos Tzabouras is a graduate of the Department of International & European Economic Studies at the Athens University of Economics and Business. He has a long time presence at FXCM, as he joined the company in 2011. He has served from multiple positions, but specializes in financial market analysis and commentary.
With his educational background in international relations, he emphasizes not only on Technical Analysis but also in Fundamental Analysis and Geopolitics – which have been having increasing impact on financial markets. He has longtime experience in market analysis and as a host of educational trading courses via online and in-person sessions and conferences.
Any opinions, news, research, analyses, prices, other information, or links to third-party sites contained on this website are provided on an "as-is" basis, as general market commentary and do not constitute investment advice. The market commentary has not been prepared in accordance with legal requirements designed to promote the independence of investment research, and it is therefore not subject to any prohibition on dealing ahead of dissemination. Although this commentary is not produced by an independent source, FXCM takes all sufficient steps to eliminate or prevent any conflicts of interests arising out of the production and dissemination of this communication. The employees of FXCM commit to acting in the clients' best interests and represent their views without misleading, deceiving, or otherwise impairing the clients' ability to make informed investment decisions. For more information about the FXCM's internal organizational and administrative arrangements for the prevention of conflicts, please refer to the Firms' Managing Conflicts Policy. Please ensure that you read and understand our Full Disclaimer and Liability provision concerning the foregoing Information, which can be accessed here.