GER30 Tries to Pause its 4-Day Losing Streak

GER30 – H4
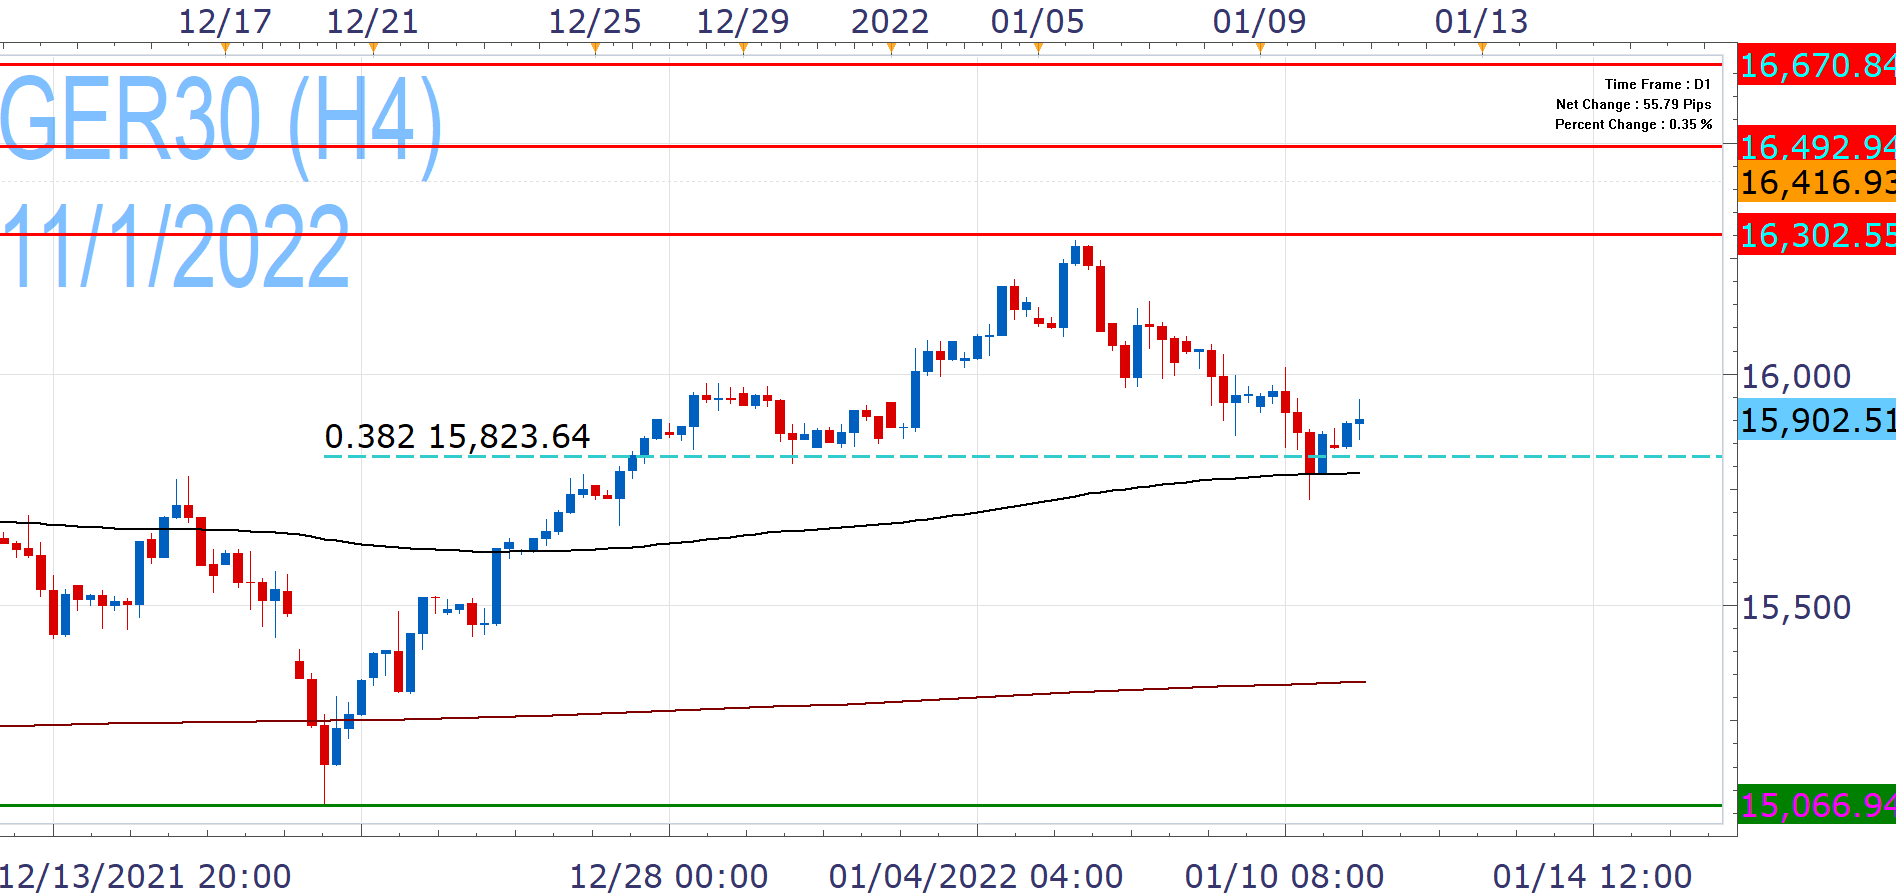
The index started the new year on the offensive, but failed to register fresh record highs last week and has since entered a correction phase, as we had warned in our previous analysis.
Today it attracts buyers and defends its EMA200 (black line) and 38.2% Fibonacci of the "December Low/January High" advance. Above it, the upside momentum remains in place, but it may be early for record highs (16,302).
Despite starting the day in a positive mood, overall sentiment has been cautious this week and GER30 remains in somewhat precarious position, following its recent slide. As such, it is vulnerable to 15,679-1, but a catalyst will be required for a larger decline that will threaten the 200Days EMA (15,330-55).
The next leg of the move will probably rely on broader market sentiment, as investors await Fed's Powell testimony later in the day, in an otherwise light economic calendar.
Past Performance: Past Performance is not an indicator of future results.

Nikos Tzabouras
Senior Financial Editorial Writer
Nikos Tzabouras is a graduate of the Department of International & European Economic Studies at the Athens University of Economics and Business. He has a long time presence at FXCM, as he joined the company in 2011. He has served from multiple positions, but specializes in financial market analysis and commentary.
With his educational background in international relations, he emphasizes not only on Technical Analysis but also in Fundamental Analysis and Geopolitics – which have been having increasing impact on financial markets. He has longtime experience in market analysis and as a host of educational trading courses via online and in-person sessions and conferences.
Any opinions, news, research, analyses, prices, other information, or links to third-party sites contained on this website are provided on an "as-is" basis, as general market commentary and do not constitute investment advice. The market commentary has not been prepared in accordance with legal requirements designed to promote the independence of investment research, and it is therefore not subject to any prohibition on dealing ahead of dissemination. Although this commentary is not produced by an independent source, FXCM takes all sufficient steps to eliminate or prevent any conflicts of interests arising out of the production and dissemination of this communication. The employees of FXCM commit to acting in the clients' best interests and represent their views without misleading, deceiving, or otherwise impairing the clients' ability to make informed investment decisions. For more information about the FXCM's internal organizational and administrative arrangements for the prevention of conflicts, please refer to the Firms' Managing Conflicts Policy. Please ensure that you read and understand our Full Disclaimer and Liability provision concerning the foregoing Information, which can be accessed here.