GER30 Catches a Breath after Thursday’s Drop & the ECB’s Rate Hikes Signal

GER30 Analysis
The German index is had started the week in upbeat mood, but failed to move past key technical levels and unfavorable market news have then weighed on it.
Yesterday, the European central bank confirmed its hawkish pivot, since it announced the end of its asset purchases (APP) in July 1 and laid out a plan to increase rates by 25 basis in July, while opening the door to an even larger move in September.[1]
Furthermore, the ECB raised its forecast for Inflation in the Euro Area, now seeing it at 6.8% in 2022, from 5.1% in the March projections. Economic growth forecasts on the other hand were downgraded, with 2022 GDP now expected at 2.8%, from 3.7% prior projection. This comes just a few days, after the World Bank had slashed its global growth forecasts, projecting it at 2.5% for the Euro Area.[1]
Oil prices remain high, despite last week's accelerated production boost plan by OPEC+, which puts upwards pressure on inflation and hinders economic activity. The ECB acknowledged yesterday, that the was in Ukraine "contributes to high energy and commodity prices" and along with more related factors, they "weigh on confidence and dampen growth".
Now markets will turn to the inflation update from the US, in the form of the Consumer Price Index, which is due later today.
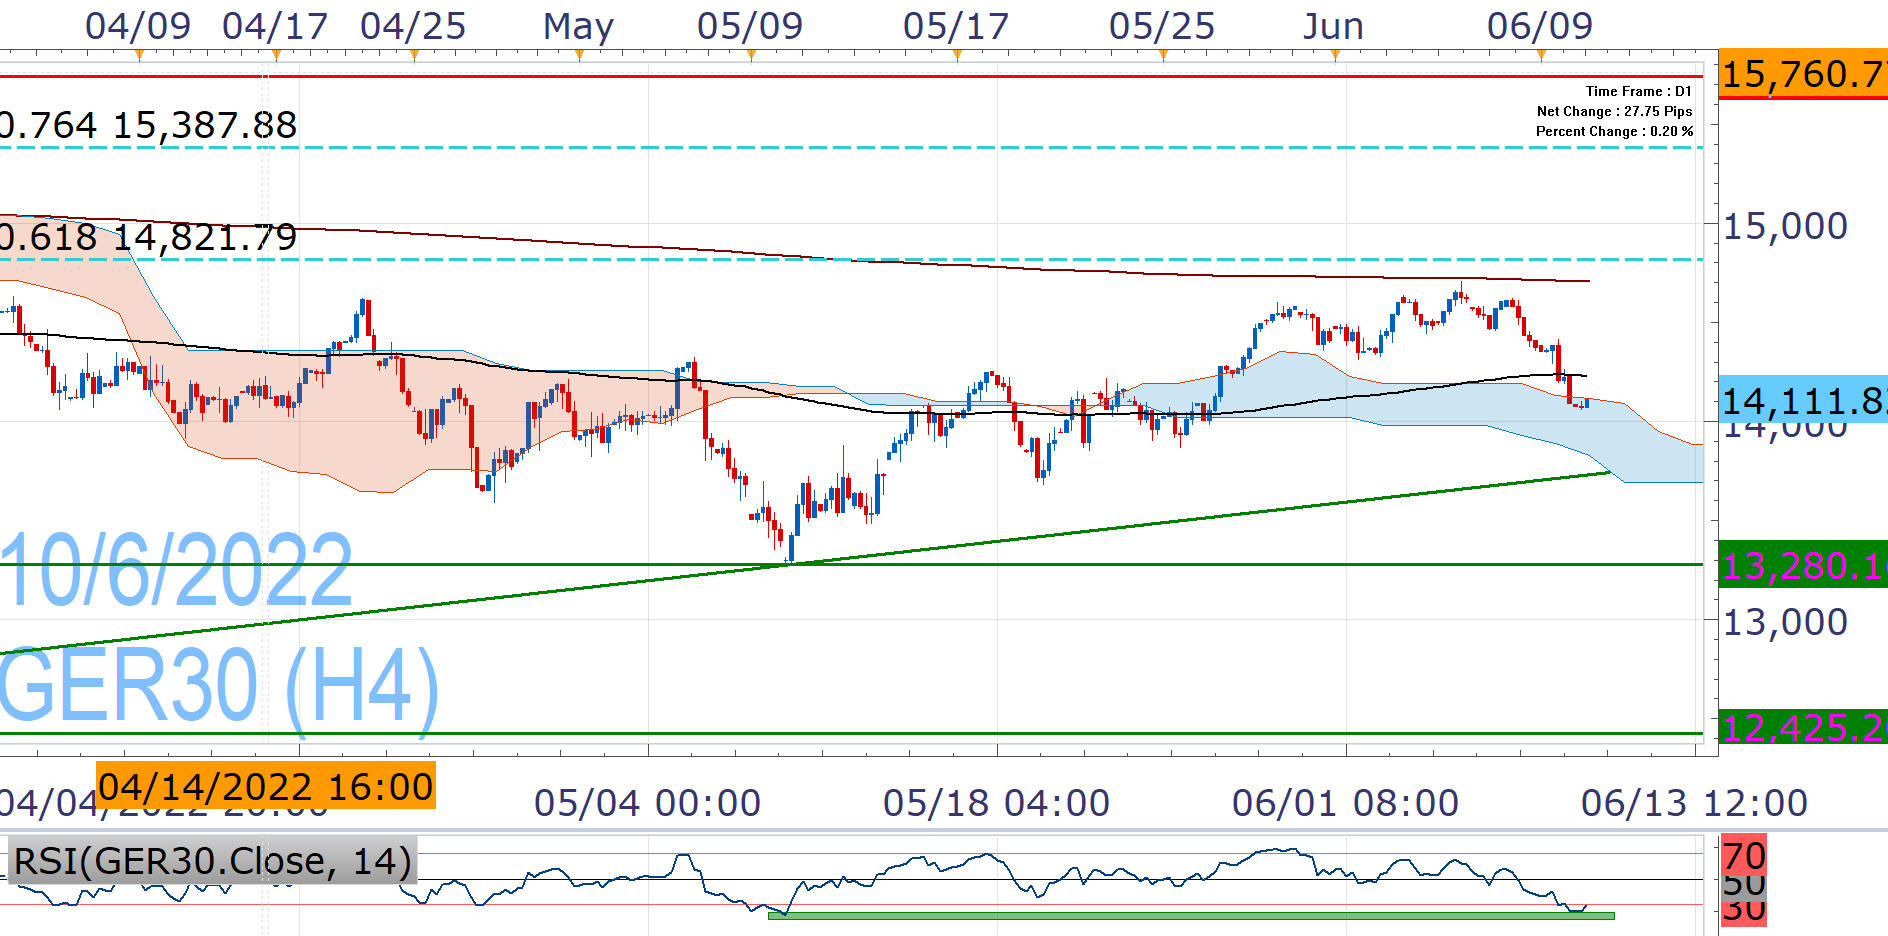
GER30 slumped after the ECB's detailed its tightening intentions, closing Thursday below the EMA200 and inside the daily Ichimoku Cloud. This makes it vulnerable to further pressure that could test the lower border of the cloud and the ascending trendline from the 2022 lows (at mid-13,700s), although a fresh catalyst would be required for moves below it that would put 13,280 in question.
Despite yesterday's decline, the index tries to take a breath today, as the Relative Strength Index (RSI) is at the most oversold levels since the May lows, which had led to noteworthy recovery. As we had indicated in the last analysis current area can be supportive.
As such, a return back above the EMA200 (black line) would be likely, but we struggle to see at this stage, how GER30 could surpass the key 14,700-14,821 resistance. This includes the 200Days EMA and the 61.8% Fibonacci of the 2022 High/Low drop, which it had rejected at the start of the week.

Nikos Tzabouras
Senior Financial Editorial Writer
Nikos Tzabouras is a graduate of the Department of International & European Economic Studies at the Athens University of Economics and Business. He has a long time presence at FXCM, as he joined the company in 2011. He has served from multiple positions, but specializes in financial market analysis and commentary.
With his educational background in international relations, he emphasizes not only on Technical Analysis but also in Fundamental Analysis and Geopolitics – which have been having increasing impact on financial markets. He has longtime experience in market analysis and as a host of educational trading courses via online and in-person sessions and conferences.
References
| Retrieved 10 Jun 2022 https://www.ecb.europa.eu/press/pr/date/2022/html/ecb.mp220609~122666c272.en.html |
Any opinions, news, research, analyses, prices, other information, or links to third-party sites contained on this website are provided on an "as-is" basis, as general market commentary and do not constitute investment advice. The market commentary has not been prepared in accordance with legal requirements designed to promote the independence of investment research, and it is therefore not subject to any prohibition on dealing ahead of dissemination. Although this commentary is not produced by an independent source, FXCM takes all sufficient steps to eliminate or prevent any conflicts of interests arising out of the production and dissemination of this communication. The employees of FXCM commit to acting in the clients' best interests and represent their views without misleading, deceiving, or otherwise impairing the clients' ability to make informed investment decisions. For more information about the FXCM's internal organizational and administrative arrangements for the prevention of conflicts, please refer to the Firms' Managing Conflicts Policy. Please ensure that you read and understand our Full Disclaimer and Liability provision concerning the foregoing Information, which can be accessed here.