Bitcoin top-down analysis – 18 July 2022

Weekly
.png)
Bitcoin's RSI touched oversold a month ago, on 18 June (black vertical line). Since then, the cryptocurrency has bounced as the oscillator normalised. However, the weekly chart shows a lower peak (LP) followed by a lower trough (LT). This pattern defines the cryptocurrency's primary trend, which is still down. Moreover, this scale's momentum is down, with the stochastic positioned in its lower quintile (green rectangle).
Daily
.png)
Since the oversold reading on the weekly, the daily chart has pulled back to relieve this pressure. As a result, daily price action may have charted a flag continuation pattern (parallel turquoise lines). However, a valid pattern must complete with a breakdown. Current price action is, to the contrary, testing the upper boundary.
Therefore, we note a resistance level (red shaded horizontal) at current price levels. If broken to the upside, price action will nullify the continuation pattern.
Real Rates are Helping BTCUSD
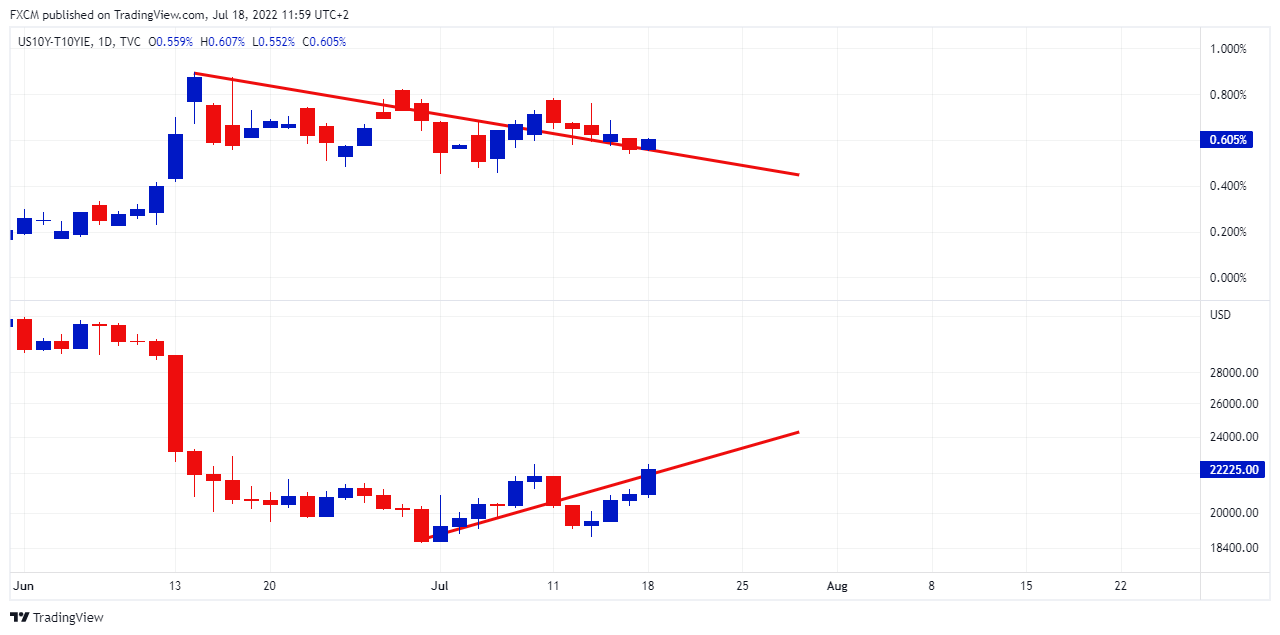
Source: www.tradingview.com
Since the weekly RSI touched oversold, real interest rates have declined (top chart). This decline has supported risk instruments. In this regard, BTCUSD (bottom chart) appreciated during the period. As such, real rates are essential to keep an eye on. Therefore, Fed policy remains a vital determinant for the bitcoin trajectory.

Russell Shor
Senior Market Specialist
Russell Shor joined FXCM in October 2017 as a Senior Market Specialist. He is a certified FMVA® and has an Honours Degree in Economics from the University of South Africa. Russell is a full member of the Society of Technical Analysts in the United Kingdom. With over 20 years of financial markets experience, his analysis is of a high standard and quality.
Any opinions, news, research, analyses, prices, other information, or links to third-party sites contained on this website are provided on an "as-is" basis, as general market commentary and do not constitute investment advice. The market commentary has not been prepared in accordance with legal requirements designed to promote the independence of investment research, and it is therefore not subject to any prohibition on dealing ahead of dissemination. Although this commentary is not produced by an independent source, FXCM takes all sufficient steps to eliminate or prevent any conflicts of interests arising out of the production and dissemination of this communication. The employees of FXCM commit to acting in the clients' best interests and represent their views without misleading, deceiving, or otherwise impairing the clients' ability to make informed investment decisions. For more information about the FXCM's internal organizational and administrative arrangements for the prevention of conflicts, please refer to the Firms' Managing Conflicts Policy. Please ensure that you read and understand our Full Disclaimer and Liability provision concerning the foregoing Information, which can be accessed here.