AAPL valuation may suggest the stock is trading at a significant discount to intrinsic value

Depending on one's assumptions, AAPL may be considered undervalued at its current market price of $143.78 per share. In addition, since 2013, AAPL's mean dividend growth rate per share has been 9.57%, with DPS for 2021 at 0.85cps.
Currently, the stock's beta is 1.19, and according to Statista the average market risk premium for the USA from 2011 to 2021 was 5.5%. Given the current concern over stagflation, we add 0.5% as an additional risk premium and assume 6% as the equity market risk premium. Finally, we will use 2.80% as an appropriate risk-free rate considering the US 10-yr yield. Using the CAPM, we derive a required return on equity of 9.94%.
Using a dividend discount model:
1. We applied the dividend growth of 9.57% to 0.85 and extrapolated it to 2025. We are comfortable with this assumption, with an astounding ROE of 147.44% and a high retention rate.
2. We then used the Gordon Growth Model to derive the terminal value for the periods outside forecast, at the mean dividend growth of 9.57%.
3. Finally, we discounted these back to the present, arriving at an intrinsic value of $228.94 per share.
This calculation implies that AAPL is trading at a significant discount to its fundamental value. However, we note that the model is extremely sensitive to our assumptions. Just because it seems cheap now doesn't mean it won't become even cheaper.
Consider the AAPL weekly chart: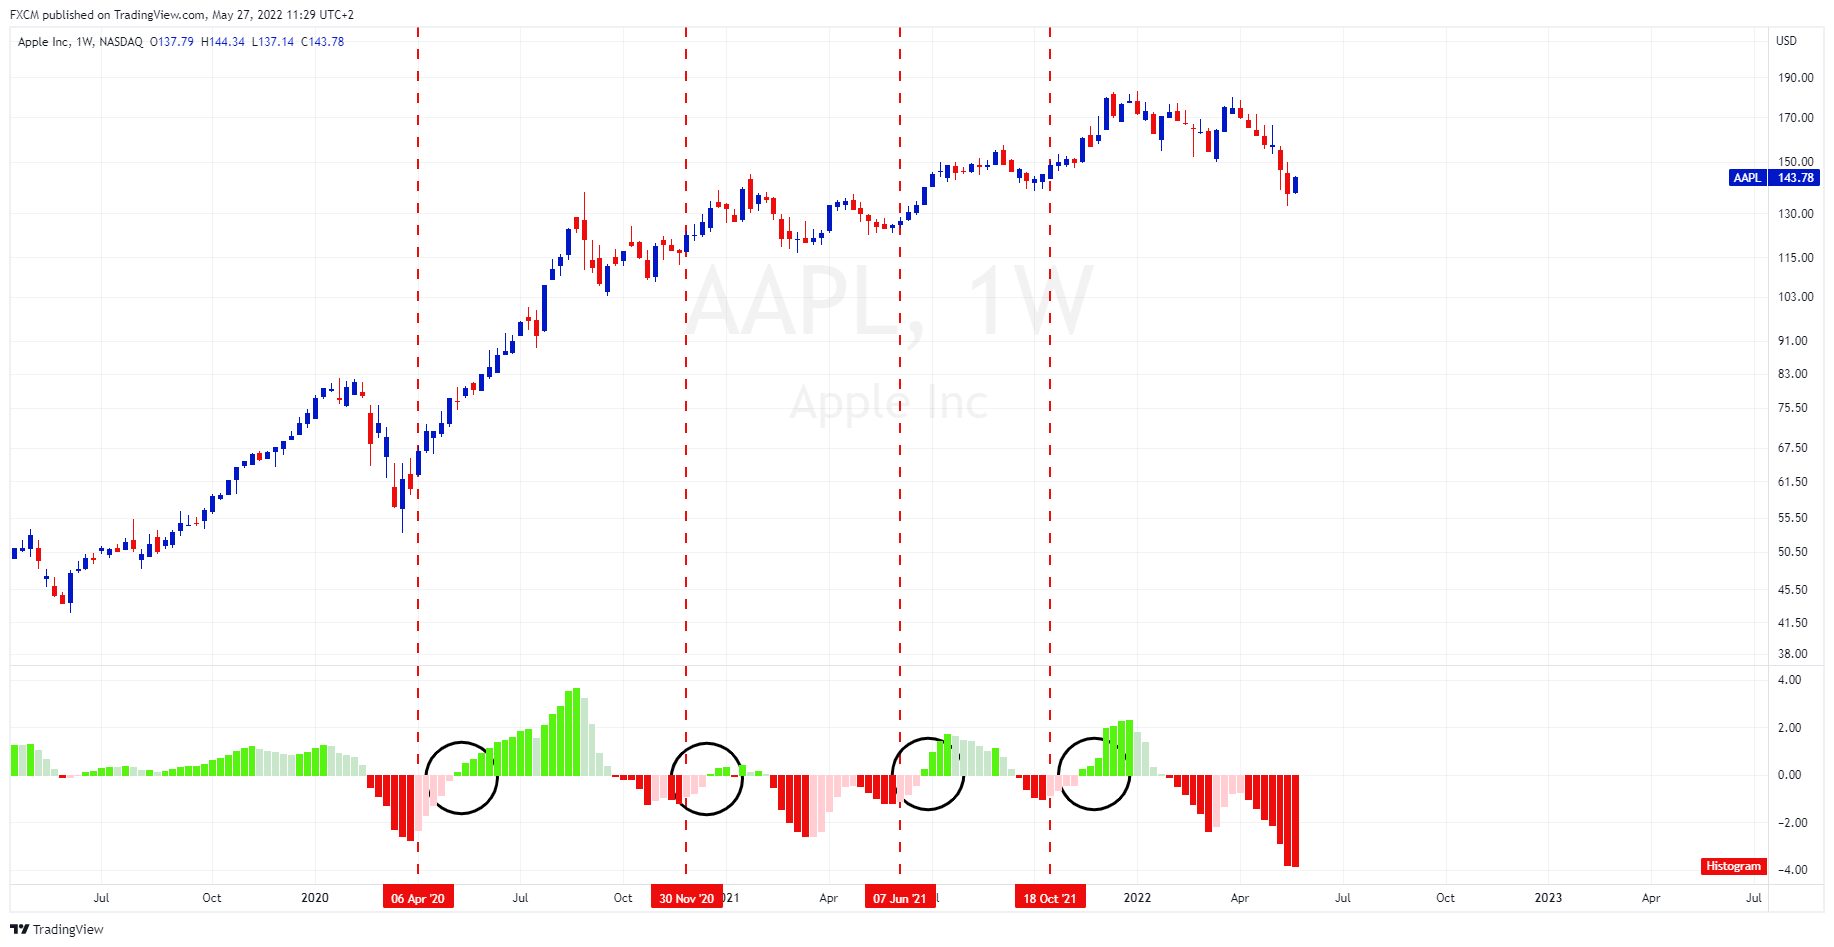
Source: www.tradingview.com
This chart may aid in timing, given the assumed discount. Therefore, we have added a MACD histogram to the weekly chart. A MACD histogram tick up (red dashed vertical), then crossing positive (black ellipse), suggests price appreciation. A tick up without a positive cross is less reliable.
The MACD histogram has yet to tick up or cross positive. This lack of technical progress gives us reason to pause.
Reference:
www.statista.com
www.koyfin.com

Russell Shor
Senior Market Specialist
Russell Shor joined FXCM in October 2017 as a Senior Market Specialist. He is a certified FMVA® and has an Honours Degree in Economics from the University of South Africa. Russell is a full member of the Society of Technical Analysts in the United Kingdom. With over 20 years of financial markets experience, his analysis is of a high standard and quality.
Any opinions, news, research, analyses, prices, other information, or links to third-party sites contained on this website are provided on an "as-is" basis, as general market commentary and do not constitute investment advice. The market commentary has not been prepared in accordance with legal requirements designed to promote the independence of investment research, and it is therefore not subject to any prohibition on dealing ahead of dissemination. Although this commentary is not produced by an independent source, FXCM takes all sufficient steps to eliminate or prevent any conflicts of interests arising out of the production and dissemination of this communication. The employees of FXCM commit to acting in the clients' best interests and represent their views without misleading, deceiving, or otherwise impairing the clients' ability to make informed investment decisions. For more information about the FXCM's internal organizational and administrative arrangements for the prevention of conflicts, please refer to the Firms' Managing Conflicts Policy. Please ensure that you read and understand our Full Disclaimer and Liability provision concerning the foregoing Information, which can be accessed here.